 > ENC Master > Climate Encyclopaedia > Food & Climate > basics > 1. Plants and climate > * Worksheet 2
 |
|
|
|
|
|
|
|
|
Worksheet 2: Distribution of Crops
|
|
|
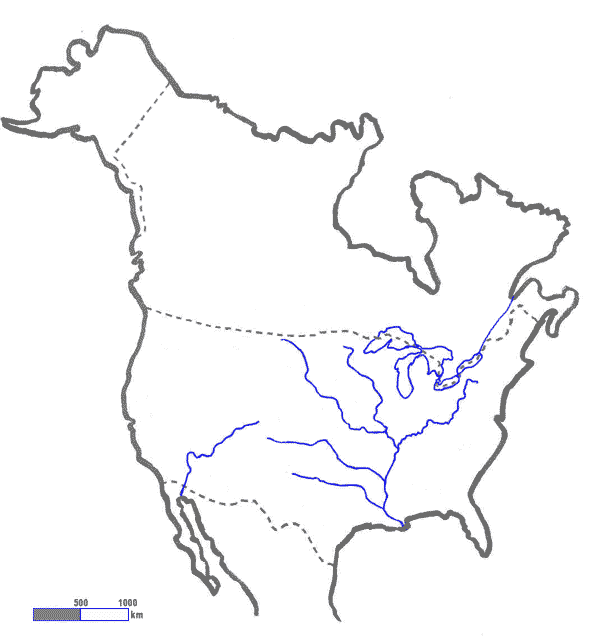
Exercise 1:1. Mark the major producing areas of - corn (orange), in Northern America on your map according to the information provided in your atlas. If you don't have an atlas at hand use the online atlas of the United States: Click on the + of agriculture and select the product Use the "zoom in" function to see more detail, add the "streams and waterbodies" and decide if this is helpful or not. (Admittedly, our worksheet was made with the Diercke Weltatlas, which explains some differences.)
|
 |
|
map of North America, drawn by Florian Schäfer |
Exercise 2:After having finished this, try to find explanations for the position of the production areas according to the information you received from the text. The climate maps of North America from your atlas will help you.
|
|
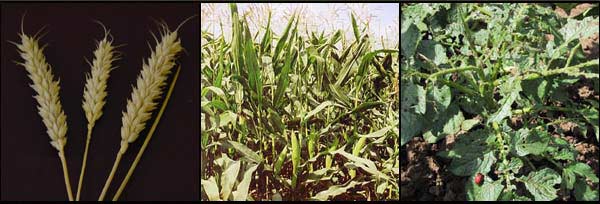
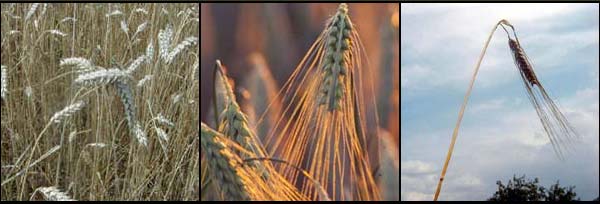
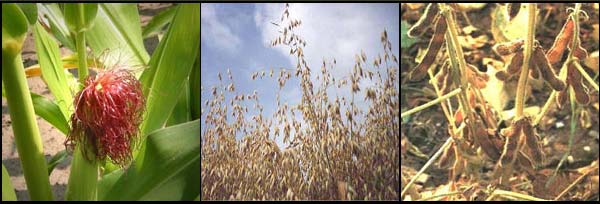
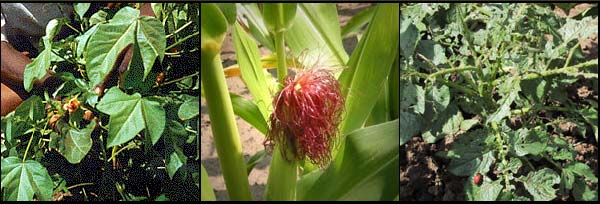
Exercise 4:In the table of the text, you have read some information about the effects which high temperature and soil moisture can have on some major field crops. But do you know how these crops look like? 1. Which of these three pictures shows corn?
|
 |
|
|
|
|
 |
|
|
|
|
 |
|
|
|
|
 |
|
|
photo courtesy of all quiz pictures: Hemera - Big box of art |
1. Scientific reviewer: 2. Scientific reviewer: Educational reviewer: Prof. Schrettenbrunner, Dr. Schleicher, J. Heres Last update: 07/01/2004 |
