 > English > Climate Encyclopaedia > Food and Climate > basics > 1. Plants and climate > * Worksheet 2
|
|
|
|
|
|
|
|
|
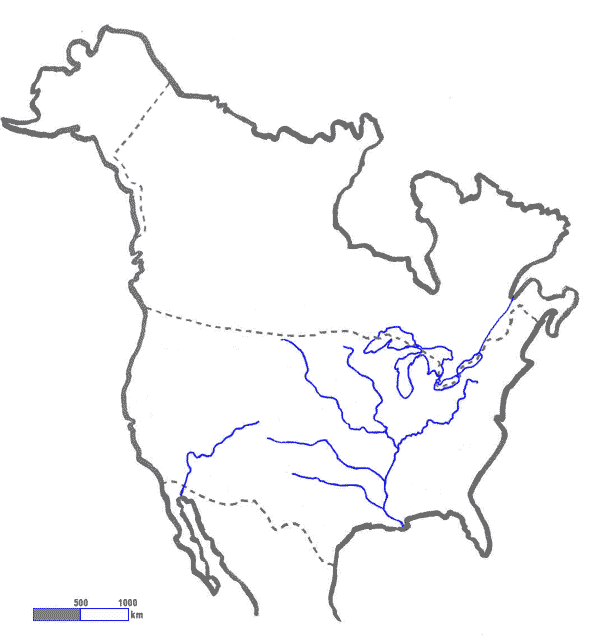
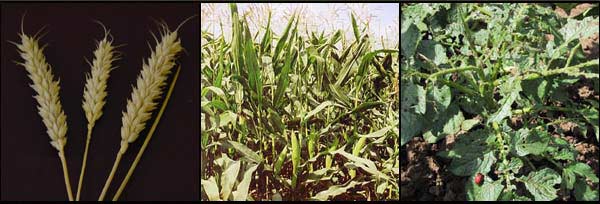
Exercise 1:Print out the worksheet and find an altas. - maize/sweetcorn (orange), on your map. Once you have done this, compare your results with the crop maps from the online atlas of the United States: Click on the + of agriculture and select the crop (soybean, cotton, corn, wheat), Use the "zoom in" function for more detail, add "streams and waterbodies" and decide if this is helpful or not. (Our worksheet was made with the Diercke Weltatlas. The online map will give slightly different results).
|
 |
|
1. Map of North America, drawn by Florian Schäfer.
|
Exercise 2:Use the information from the text and climate maps of North America from your altas to try and explain why the crops are grown in these locations.
|
|
 |
|
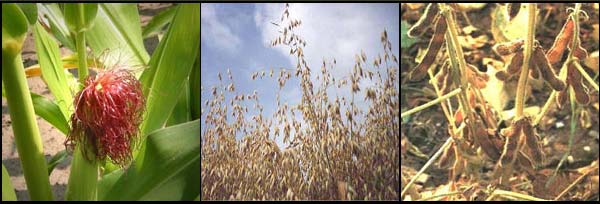
image 2. a-c) |
|
|
 |
|
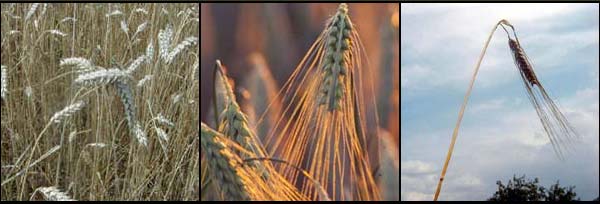
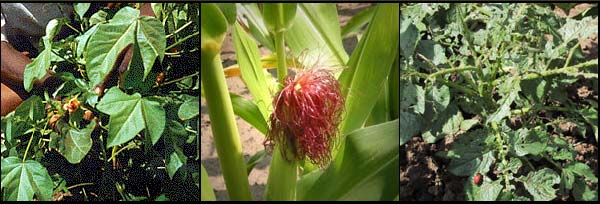
image 3. a-c) |
|
|
 |
|
|
|
|
 |
|
|
Photographs: Hemera - Big box of art.
|
About this page: author: F. Schäfer - University of Nürnberg, Nürnberg, Germany educational reviewer: Prof. Helmut Schrettenbrunner, Dr. Yvonne Schleicher and Julia Heres - University of Nürnberg, Nürnberg, Germany last update: 2004-01-07
|
