> ENC Master > Climate Encyclopaedia > People changing climate > more > 2. How will future be? > * Worksheet 1
|
 |
How are people changing the climate?
Read more |
2. What will a warmer world be like?
Worksheet 1 |
1. Questions to be answered individually or in groups
a) What is a scenario? What makes climate scenarios different from weather forecasts?
b) All scenarios used by scientists in climate modeling imply that even if we freeze on today's level of emissions, the temperature in the atmosphere will nevertheless continue to rise during the next century and the sea level will rise during the next millennium. Why is this so? |
|
 |
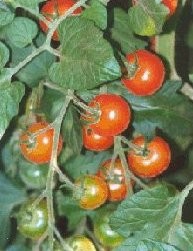
(photo: www.letsgroworganic.co.uk)
|
|
 |
Higher temperatures may lead to more frequent and more violent showers. This may for instance have implications for growing tomatoes, since tomatoes are vulnerable to hail and flood and need an even distribution of rain and sun in order to grow. Thus, the higher temperature affects the tomato farmers since they will get smaller crops. Maybe it will also affect you, since you may have to pay more for the tomatoes?
|
The text describes how climate change may have consequences for tomato crops, for the farmer growing tomatoes, and for you. Such changes may also affect your life such that for instance sports events or festivals may need to get cancelled because of the weather.
|
Pros :-) |
Cons :-( |
Drought |
|
|
More violent snow- and rainfall |
|
|
Higher daytime temperatures |
|
|
More sunshine |
|
|
Less sunshine |
|
|
More wind |
|
|
Make a table equivalent to this table, and for each of the climate phenomena in the table, write down how you expect this to affect your life. Categorise the consequences for you as positive or negative (note that not all the boxes need to be filled – maybe there are climate phenomena/changes that are ONLY positive or ONLY negative for you). |
3. Climate scenarios and CO2 emissions |
|
 |
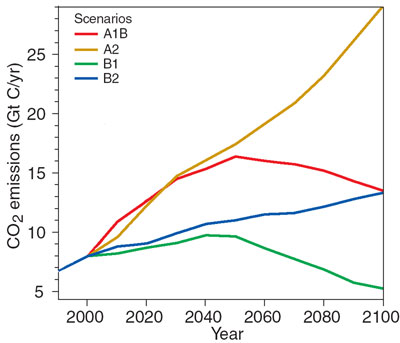
How CO2 emissions might develop over the coming century, according to four different scenarios. Adapted from IPCC. (click to enlarge, 60 kB)
|
|
 |
Study the diagram and refer to what the text says about the four scenarios that the climate panel (IPCC) is drawing. The diagram shows how carbon emission may develop in the future, given each of the four scenarios.
Why do you think it will increase so much in scenario A2? Why will emissions go down after the year 2050 in scenario A1? Why is B1 the scenario which gives the least carbon emission? |
Authors: Ellen K. Henriksen and Camilla Schreiner - University of Oslo - Norway. Scientific reviewer: Andreas Tjernshaugen - CICERO (Center for International Climate and Environmental Research - Oslo) - Norway - 2004-01-20 Educational reviewer: Educational reviewer: Nina Arnesen - Marienlyst school in Oslo - Norway - 2004-03-10. Last update: 2004-03-27.
|
© ESPERE-ENC 2013 | www.espere.net