
> English > Climate Encyclopaedia > Lower Atmosphere > more > 2. Radiation & greenhouse gases > * Worksheet 1
|
|
 |
Lower Atmosphere
Read more |
2. Radiation and greenhouse gases - more
Worksheet 1: Experiments with the greenhouse gases CO2 and water |
|
These experiments will give you an idea how carbon dioxide and water act as greenhouse gases by looking at how heat radiation is absorbed.
|
 |
|
|
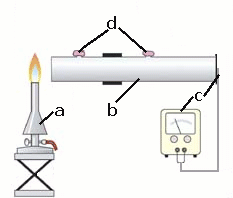
Figure 1. Experimental set-up for E1.
a: gas burner; b: metal tube (made from cans) with two openings; c: temperature sensor with indicating instrument; d: play dough to close openings.
© 2004 Tausch, Seesing; Uni-Duisburg-Essen, Duisburg [Lit.: Tausch, von Wachtendonk: Chemie 2000+; Buchner Verlag; Bamberg 2001]
|
|
|
Heat absorption:
Figure 1. shows you how to set up the experiment. To make the metal tube, remove the lids and bases from two cans. Connect the cans with tape so that the join is airtight and drill two holes into the tube as openings. Close these openings with play dough. Fit a piece of black cardboard over one end of the tube, again making sure the join is airtight. Attach the tip of a temperature sensor onto the cardboard using scotch tape. Cover with aluminium foil. This way you get a detector of heat radiation.
Place a bunsen burner between 10 and 15 cm away from the other end of the tube. Make sure the distance is the same in all the experiments.
The heat radiation warms the black cardboard and the change in temperature is recorded by the temperature sensor. During each series of experiments record the temperature every 30 seconds and plot it graphically. Carry out each experiment for three minutes. Make sure the metal tube has cooled down to the initial temperature before you start the next experiment (you might need a cold air hair-drier).
|
|
E 1 |
Carry out a series of measurements with the following materials covering the opening of the metal tube (use an elastic band to hold them on). |
|
gas inside the tube: air |
temperature [°C] after: |
|
material covering the opening: |
0 s |
30 s |
60 s |
90 s |
120 s |
150 s |
180 s |
|
a) polyethene film |
|
|
|
|
|
|
|
|
b) aluminium foil |
|
|
|
|
|
|
|
|
c) flat bag made of polyethene (empty) |
|
|
|
|
|
|
|
|
d) flat bag made of polyethene
(moistened with water inside) |
|
|
|
|
|
|
|
|
e) nothing (open end of metal tube) |
|
|
|
|
|
|
|
|
E2 |
Cover the opening of the tube with polyethylene film (as in part a above). Open the small holes and fill the tube with carbon dioxide. Close the holes with play dough and then repeat the experiment. |
|
gas inside the tube: carbon dioxide |
temperature [°C] after: |
|
material: |
0 s |
30 s |
60 s |
90 s |
120 s |
150 s |
180 s |
|
f) polyethene-foil |
|
|
|
|
|
|
|
|
T 1 |
Why does this experiment measure the propagation of heat by heat radiation rather than by convection? Give reasons for your answer. | |
|
|
T 2 |
Why is it necessary to cool down the tube to its initial temperature before each set of measurements? |
|
T 3 |
The graph of the experimental results obtained with air inside the metal tube leads to temperature-time-curves. After three minutes, the highest temperature is seen when the tube is open (e).
Our results show the following order:
e) > a) » c) > d) » f) > b)
Interpret these results in terms of the absorption of heat radiation. Arrange the materials in an order of their decreasing heat absorption. |
|
T 4 |
Why do you have to repeat the experiment with polyethylene film (a) but with carbon dioxide in the tube if you want to learn about heat absorption of carbon dioxide? |
|
T 5 |
Carbon dioxide CO2 is a greenhouse gas which contributes to global warming. However, the results for carbon dioxide in the metal tube show that the temperature doesn't rise as much as it does with air inside the tube.
What is the reason for this? Mark the correct answer(s):. |
c This result is wrong, the experiment has to be repeated.
c CO2 is not a greenhouse gas.
c CO2 can absorb heat better than air, therefore the temperature
does not rise as high.
c This experiment has nothing to do with the greenhouse effect.
|
 |
|
|
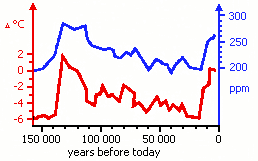
Figure 2
The amount of CO2 in the atmosphere (right axis, blue curve) and the relative temperature (left axis, red curve) over the past 160 000 years.
© 2004 Seesing, Tausch; Universität Duisburg-Essen, Duisburg [Lit:Tausch, von Wachtendonk: 2000+, Buchner Verlag, Bamberg 2001].
|
|
It is possible to measure the amount of carbon dioxide in the atmosphere of ancient times by analysing air trapped in ice cores (Figure 2).
|
T 6 |
Describe the most important features shown in Figure 2. |
|
T 7 |
Which of the statements from exercise T5 is contrary to the information shown in Figure 2? Give reasons for your answer. |
|
About this page:
authors: M. Seesing, M. Tausch - Universität Duisburg-Essen, Duisburg , Germany
last update: 2004-05-13
|
