 > English > Climate Encyclopaedia > Climate in Cities > basics > 2. Urban Climate > * Worksheet 3
|
|
|
1. Wind in the cityAir warms up faster in cities compared to rural areas, particularly on summer days. This leads to low pressure areas in the cities and higher air pressures in the surrounding countryside. As a result of this pressure gradient, air moves into the cities from the rural areas. The air follows the corridors made by the main roads and its speed decreases by up to 50%. Once in the centre of the city, the wind speed rises by up to 20% as it moves around street corners and eddies may be formed. In the centre of the city the temperature of the air increases and the warmer air rises along the walls of the houses higher into the atmosphere. It then moves back towards the suburbs as a so-called anti-breeze. It then cools down, gets heavier and sinks and comes back to the city as an urban breeze. Compare the rural-urban wind patterns with the circulation of air in tropical regions or the circulation of air over the land and the sea. Ask your geography teacher for details.
|
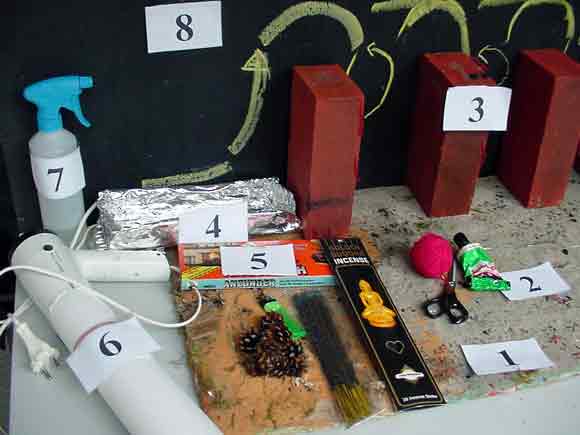
2. ExperimentYou can find out how the wind generates eddies with this experiment 2.1 Safety Information- Only conduct these experiments in a physics or chemistry laboratory or outside in a sand box. You will need:
|
 |
|
1. Equipment needed for the experiment. Photograph: Gert Bauer.
|
Material:1. concrete or asbestos tile to use as a base 2.2 Setting up the experiment
|
 |
|
2. Experimental set-up. Photograph: Gert Bauer.
|
|
2.3 Carrying out the experiments:1. Put the fir cones onto the brick covered with aluminium foil and set light to them.
|
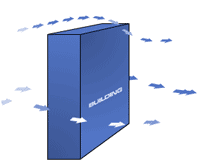
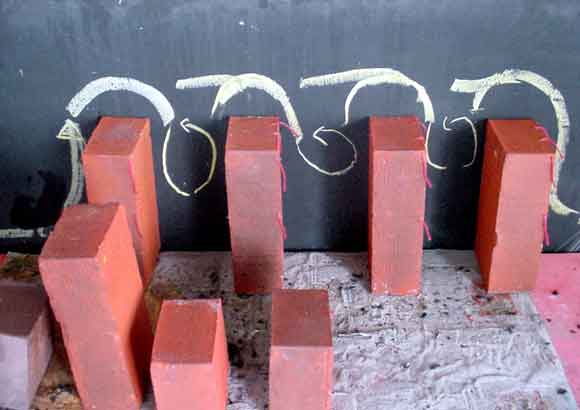
Experiment 1First we look at how the wind moves around a multi-storey building. The wind can either rise up the building or circle around the building and this movement causes the wind speed to increase by up to 20%. First blow the smoke towards the long side of the first high brick in the row and watch how the smoke moves around it. Vary the distance and angle between the hair dryer and the brick. Watch how the smoke then moves around the next brick.
|
|
|
Click on the icon to see a short movie showing how air flows around a building. Movie: G. Bauer and B. Wohlhöfer.
|
|
|
|
Attention:
|
 |
|
5. Air movement around buildings. Photograph: Gert Bauer.
|
|
Click on the icon to see a movie about the experiment! Movie: G. Bauer and B. Wohlhöfer.
|
|
|
|
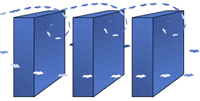
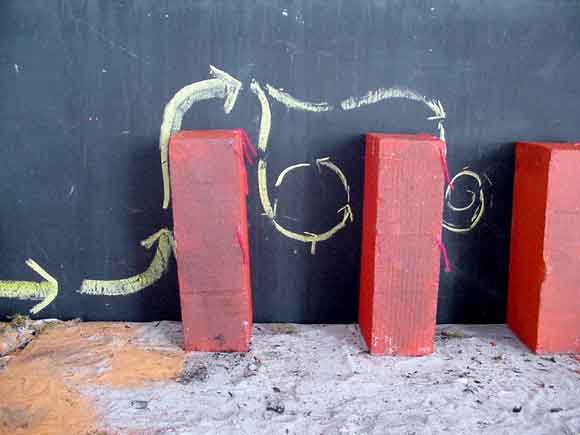
Experiment 2In this experiment we will look at how air moves around a row of houses and how it whirls on the leeward (sheltered) side of each building. Use the hairdryer to blow the smoke above the top of the bricks. Watch how the smoke blows over and around the buildings and whirls around in the sheltered areas between the bricks.
|
 |
|
8. Simplified stream of air along a row of houses. Photograph: Gert Bauer.
|
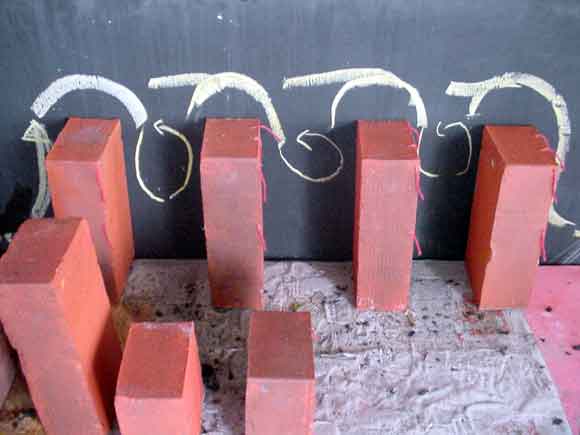
Experiment 3Set out the bricks so that the bricks at the back are approximately three times higher than the the bricks at the front and so there is some kind of square in the centre of the experimental setup. The experiment aims to show how the wind moves around street corners and in squares and how its speed increases by up to 20%. Blow the smoke from the left into the model of the city. In our experiments we decided that the whirls where strongest when the smoke was blown into the street at an angle of 45°.
|
 |
|
9. Idealised airstream in a city. Photograph: Gert Bauer.
|
|
Click on the icon to see a movie of the experiment. Movie: G. Bauer and B. Wohlhöfer.
|
|
|
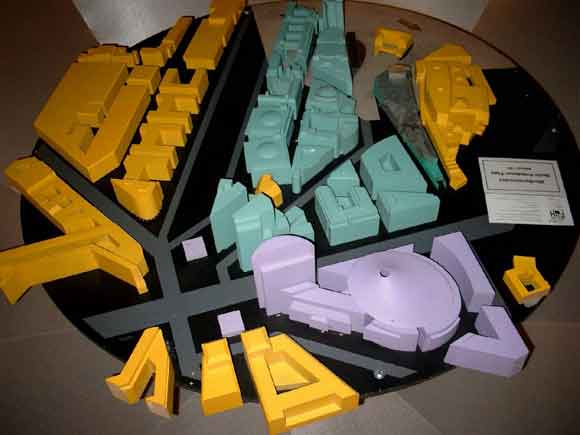
3. Importance of wind in cities3.1 Wind tunnel testsBefore new parts of a city are built, tests are made using models to look at how the air flow will change in the city and if strong winds are generated at particular corners. The image below shows a wind tunnel model of the newly built Potsdamer Platz in Berlin.
|
 |
|
11. Photo taken by Elmar Uherek at the climate exhibiton at the German Museum, Munich.
|
|
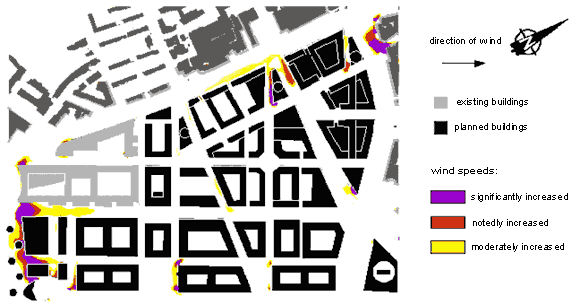
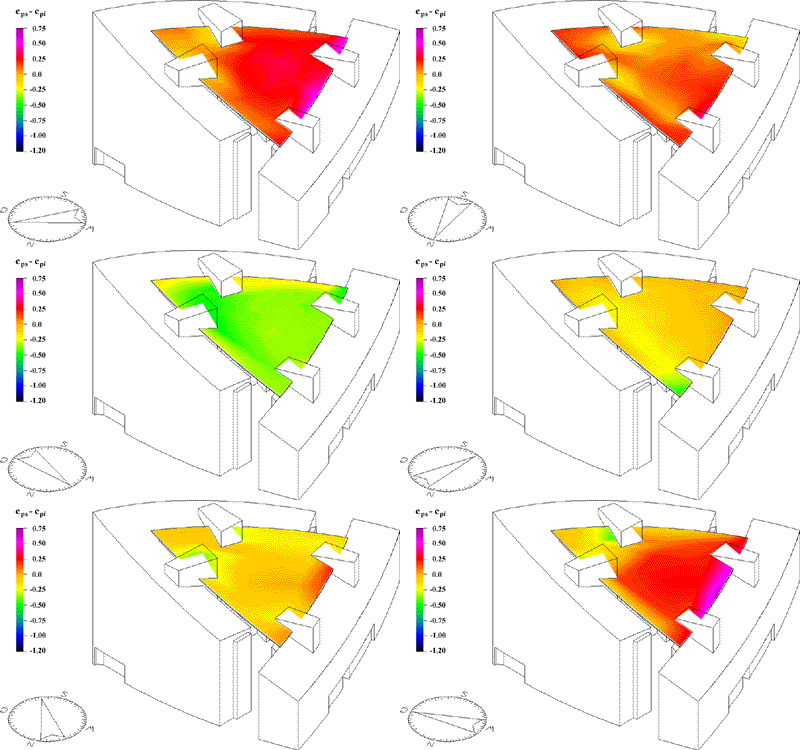
The most important parameters which influence the wind in a city are the wind profile and the roughness of the ground. These parameters are simulated in the wind tunnel tests. With the help of this simulation, whole areas of a city or single buildings can be tested in detail. The results of a wind tunnel test look like this:
|
|
Further links: www.ruscheweyh.de/bauwesen.php 3.2. Windload on a buildingThe windload on a building changes with time and space. It works directly on the outside surface of closed building and indirectly via openings on inside walls. It depends on the dominant wind direction and wind speed. The following animation from an aerophysics company shows the how the windload on a building changes with time: |
 |
|
13. Windload on a building. Author: Gesellschaft für Aerophysik mbH, Munich.
|
About this page:authors: G. Bauer and B. Wohlhöfer- University of Nürnberg, Germany
|

