 > ACCENT en > Climate Change classes 1 > 3 Albedo > Background albedo change
|
The albedo of our planet is changingThe albedo is of great importance for the Earth's warming and the global climate. The albedo tells us what percent of the Sun's radiation is reflected directly back to space, preventing the Earth from taking up its energy. This fraction is in the range of 30%. Changes in the landscape and in the Earth's climate can lead to changes in the albedo, which in turn have an impact on the Earth's radiation budget and therefore lead to a warming or cooling at the Earth's surface. |
|
This effect is of particular relevance in three cases: |
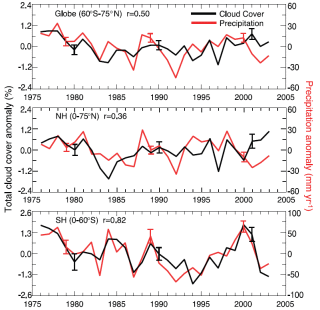
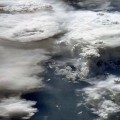 | 1) When cloud cover changes, the albedo changes as well. Since changes in the cloud cover are extremely difficult to model, this is a major reason for the uncertainty in estimations of the future climate. | |
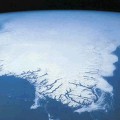 | 2) The loss of sea ice in the Arctic Ocean is an important regional effect. Here, a surface with high reflection (ice) is replaced by a surface with low albedo (ocean water). The consequence is a clearly increased uptake of energy, leading regionally to a stronger warming than expected for the rest of the world. | |
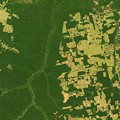 | 3) Finally, the loss of forests and the parallel extension of land used for agriculture and pasture lead to a increased albedo, since agricultural land is brighter than forests are. This contribution to a cooling of the Earth cannot however offset other disadvantageous aspects of the loss in particular of rain forest, increase in atmospheric CO2 and loss of biodiversity. |
|
|
|
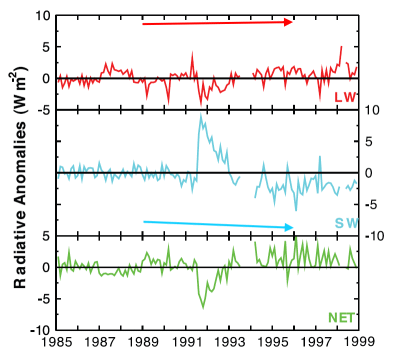
Changes can be observed in the satellite measured radiation flux on the top of the atmosphere. The graph shows results for the tropical latitudes (20°N to 20°S). Here, the radiation flux is most intensive. |
The figure presents in red the long wave radiation going out from the Earth. It increased by about 0.7 W/m2 in the period 1985 to 1999. The short wave radiation reflected by the Earth system due to its albedo is shown in light blue. The most eye-catching signal is the increased reflection of short wave radiation due to the eruption of Mt. Pinatubo in 1991, leading to a cooling lasting about more than one year. However, the long term trend in reflection is decreasing. About 2.1 W/m2 less have been reflected at the end of the period. This means the Earth took up more energy in the tropical latitudes. Satellite data show for the same period a decrease in tropical cloud cover, which could be an explanation for the findings.
|
|
|
Such studies show that cloud research aims at developing a full image from many puzzle pieces. But only the inclusion of measurements of the next two to three decades may allow us to make draw conclusions about global trends. Besides the cloud effect there is also the direct aerosol effect, in particular in the mid-latitudes of the Northern Hemisphere. This effect, caused by air pollution, is often called "global dimming" (see text for classes), but is in truth a regional effect. Most particles in the air backscatter the sunlight and increase the albedo. This is especially true for sulphate particles, which are formed from sulphur dioxide. We estimate that these aerosol effects, globally summarised, have contributed to the Earth's radiation budget by about -0.5 W/m2 (±0.4 W/m2) of cooling since 1750. |
 |
|
|
|
Loss of ice and snow covered areas, in particular in the Arctic |
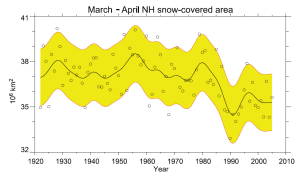
As to 2: It is becoming generally apparent that global snow cover is decreasing. However, the variation is large and changes from year to year and from region to region. The variation is strongest in autumn and summer, when the total snow cover is low. |
|
|
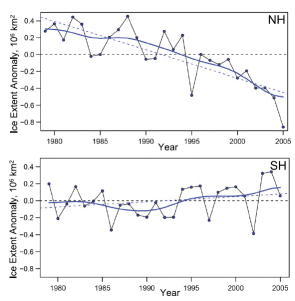
Decreasing snow-cover would promote global warming as well as a decrease in sea ice, in particular in the Arctic Ocean. The extension of sea ice has been observed by satellites since the early 1970s with an uncertainty of typically 5%. |
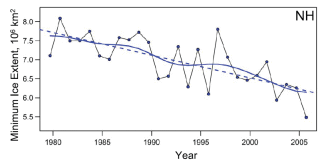
The dramatic trend in the Arctic Ocean becomes most obvious if we look at the ice area surving the summer. This area decreased by about 7.4% per decade. From this trend we can conclude that in just a few decades the Arctic Ocean will be free of ice in summer. This means extinction for the polar bear, which is specialised in hunting for seals at holes in the ice. |
|
|
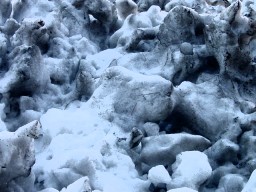
Photo: |
|
Land use changes the face of the Earth In forests the structure of the treetops helps to take up light more efficiently. The difference to woodless land is even more pronounced when the landscape is covered by snow, because in the forest multiple reflection is still taking place. |
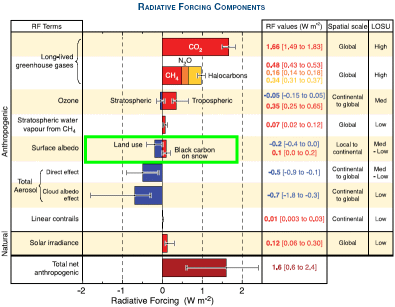
Deforestation may have lead to a change in the Earth's radiative forcing of about -0.2 W/m2 (± 0,2 W/m2) since 1750. The loss of woodland has increased the Earth's albedo. The largest uncertainties are in a clear classification of former and current landscape types. They are estimated differently in different studies. For farmland, different albedos can be assumed depending on the crops grown. An estimation of the effect is easier for pasture. |
|
|
On the other hand, human influences also make the Earth's surface darker again. Soot on ice and snow leads to a globally observed decrease in albedo. Additionally, soot makes the snow and ice melt faster. Particles and tailpipe exhaust, for example, emitted on roads and industrialised areas can be transported over large distances. In the Northern Hemisphere we find them even on glaciers and sea ice north of the Arctic Circle. Here the albedo can decrease by up to 1%. The resulting radiative forcing is in the range of 0.1 W/m2 (±0.1 W/m2). It counteracts the cooling generated by land use by a warming of half of this amount.. |
