 > ENC Master > Climate Encyclopaedia > Weather > more > 3. Biometeorology > * Worksheet2
|
|
||
|
WeatherRead more |
Worksheet: Farmer's predictionsSheet 2: Weather observation during summer |
Weather observations during summer time - The test of the Seven Sleepers’ ruleYou should have had a look at worksheet one, in which you can interactively predict your summer. Select a city in Central Europe and fill the table. Also, did you know that there is a European Weather chain, also for schools?
|
|
|
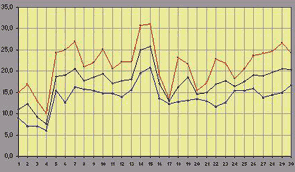
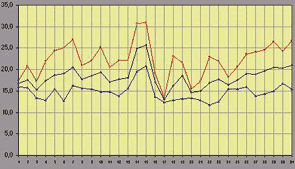
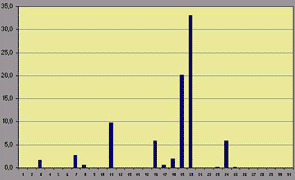
Example: Here are the weather facts of the summer of 2001.
|
|
|
|
|
|
First accept as a definition of a “summer day” the maximum temperature of 25 oC or more. |
|
If we change the definition of a summer day into 20 oC and above, in how many days did this occur? |
|
|
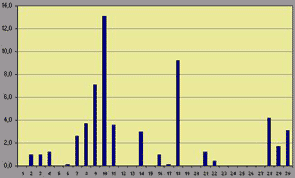
But we can also add another definition considering the rainfall.The minimum definition of a “good summer” day could be the absence of rain. |
|
|
|
|
|
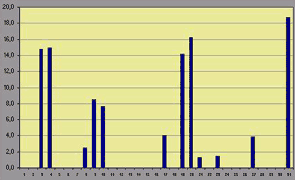
Now you can test our Seven Sleeper’ Rule according to the number of days with rainfall.If you click on the left button, you will see the number of days and if you click the right button you will see the probability in percentage.
|
|
|
|
|
|
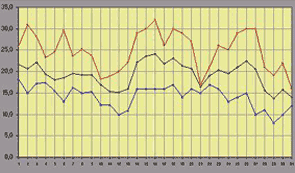
Now a combination of the definitions:A good summer has daily maximum temperatures over 20 C and little rain (below 10 mm). Another year was 2003 when the Rule was perfectly right. And how did it affect you in your home region in 2001 and 2003? And you certainly know why we assume only a 75% probability for the Rule and not 77% or even 89% as in our case. Further discussion1. We have chosen the daily maximum temperature to define “summer”. What else could you select? 2. What other weather rules do you know? 3. Why is a hot summer rather fun for the city dwellers and not for the farmers? 4. Modern weather predictions are so different. Use the LINKS and find out how.
|
About this page:- Author: Dr. Schrettenbrunner - University of Nürnberg - Germany
|

