 > ENC Master > Climate Encyclopaedia > Food & Climate > more > 3. Drought in the Mediterranean > * Worksheet 1
 |
|
|
|
|
|
|
|
Food & ClimateMore |
Worksheet: Drought in the MediterraneanSheet 1: Climate diagrams |
|
Climate diagrams are important sources to gain quick and clear information about precipitation and temperature at a certain place / region.
|
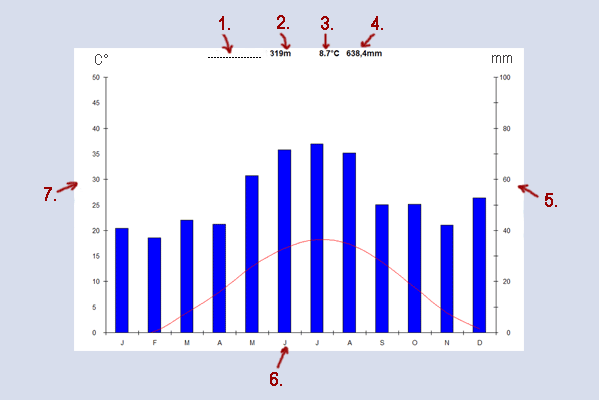
> corrected >The climate is the average weather conditions seen at a particular location. The climate, therefore, can't be observed directly. We need at least 30 years of data to determine the average climate. A climate diagram is the best way to visualise climate data. The climate diagram shown above is called a Walter Lieth diagram. On Walter Lieth diagrams 10°C on the temperature scale always correspond to 20 mm of rain on the precipitation scale. In the diagram precipitation (rainfall) is also often shown using one line instead of 12 columns. Arid and humid months can be directly read off. Arid months are months when the temperature line is higher than the precipitation line. These months are dry. The diagram above has no arid months. Humid months are months when the precipitation line is higher than the temperature line. All the months on the diagram above are humid. Climate diagrams can also be shown in different formats, for example, as circle diagrams. <<With the help of the following data you can draw your own climate diagram of Barcelona:Instruction for drawing: - Use graph paper
|
Barcelona (175m / 574 feet)
|
||||||||||||||||||||||||||||||||||||||||||||||||||||||||||||||||||||||||||||||||||||||||
|
Have a look and visit this site: www.worldclimate.com . Maybe you can find your hometown and draw a climate diagram with those data.
Collect your own data and draw a climate diagramWhat you need: Take the temperature and the amount of precipitation once a day at the same time (e.g. 13.00 hours) for 1 week and enlist the data in the table.
|
|
|
But if you want to compare the climate of different regions,
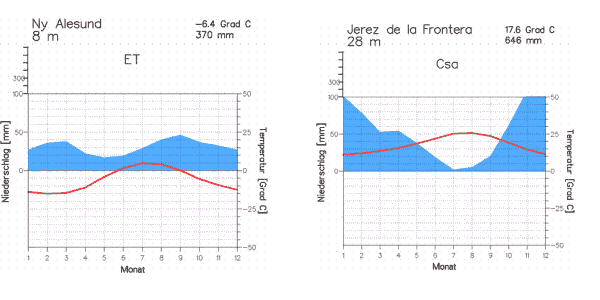
Comparison of two climate diagrams:Print out the worksheet below and try to answer the questions.
|
 |
|
Climate diagrams of Ny Alesund and Jerez de la Frontera, author: Dipl. Met. Bernhard Mühr, institute for meteorology and climate science, university of Karlsruhe, source: www.klimadiagramme.de |
About this page:- Author: S. Ancot - University of Nürnberg - Germany
|

