 > English > Climate Encyclopaedia > Lower Atmosphere > more > 3. Ozone & fire > - ozone abundance
|
Lower AtmosphereRead more |

Understanding tropospheric ozone abundanceIn this section we look at where ozone comes from and how is removed from the air.
|
Ozone control by nitrogen oxides and organic compoundsIn Unit 3 of the basics section of the Lower Atmosphere topic we learnt about the diverse characteristics of ozone and how ozone smog forms. Have a look at the chapter on 'ozone smog' again and at the scheme below.
|
 |
|
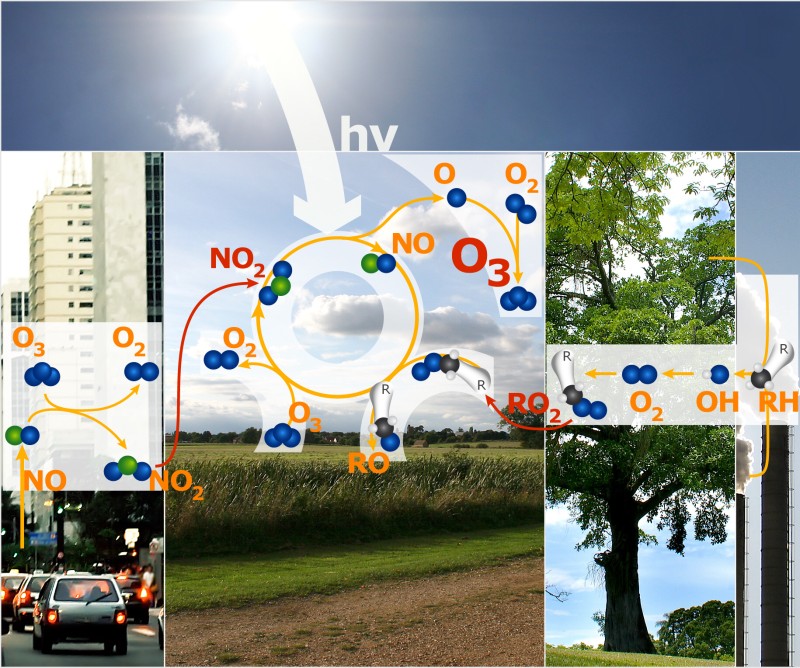
1. How ozone smog is formed. - Image: Anja Kaiser. Click on the image to enlarge! |
|
High ozone concentrations are formed in and around urban areas on hot sunny days when volatile organic compounds (VOC's) and nitrogen oxides from traffic react together.
|
The presence of nitrogen oxides and sunlight (hv) alone does not necessarily lead to ozone formation. This is because the ozone which forms simply reacts again with nitrogen oxide (NO) and is destroyed. So this reaction cycle (a so called null cycle) results in no net production or depletion of ozone in the air.
|
|
However the air also contains volatile (gaseous) organic compounds (VOC's). In chemical reactions these are often abbreviated to RH. They react with OH radicals to form peroxy radicals RO2 and these radicals oxidise NO. This prevents the NO from reacting with ozone and levels of ozone rise. hv stands for sunlight, since light energy is given by the quantum mechanical expression E = hv
|
|
|
In a diagram of so called isopleths you see black lines representing the same ozone concentrations. Production of more or less ozone strongly depends on the mixture of nitrogen oxides (NOx) and VOC's (RH) in the air. If levels of NOx are high but VOC levels are low, ozone will not be formed (blue point A) and may even be consumed in the city centre. If levels of VOC's are high but NOx levels are low, ozone concentrations are also low (point B). It is only when both NOx and VOC levels are high that ozone levels increase (point C). Since ozone levels respond quickly to the local conditions, ozone concentrations vary depending on the time of day, on how much sunshine there is and on NOx and VOC concentrations. This makes it difficult to calculate a global average ozone concentration.
|

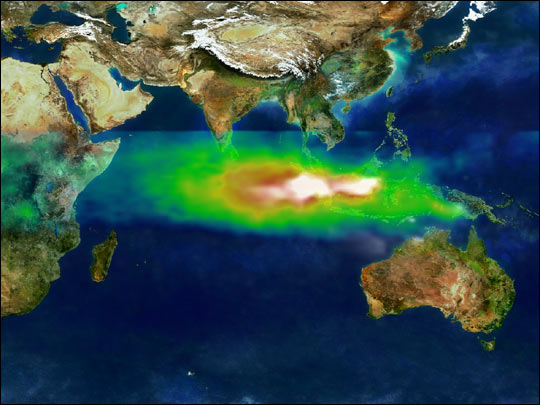
Other sourcesUrban traffic is not the only source of nitrogen oxides and is, therefore, not the only source of ozone. Nitrogen oxides are emitted during other combustion processes such as vegetation fires. The image on the right shows smog in white and increasing ozone concentrations from green to yellow to red in the plume of the big fires in Indonesia in 1997. Lightning is another source of nitrogen oxides. Some high ozone concentration events in Australia are actually the result of nitrogen oxides formed during thunderstorms and heavy lightning over South Africa.
|
|
|
Measuring ozoneThere are only a few surface ozone measurement stations in Indonesia and none over the ocean so how did we get the information about ozone concentrations during the fires? Ozone is observed from space by instruments installed on satellites. When we use satellite data we have to take into account that the instruments measure the concentration in the whole atmosphere and not just in the surface layer. Look at the ozone trend measured at the German Hohenpeissenberg Observatory. Does this mean that ozone in Germany is decreasing? Previously we learnt that tropospheric ozone levels have increased almost everywhere.
|
Although the data suggests it, tropospheric ozone levels are not falling. Ozone trends depend on the location and there are large variations in levels over the Earth. We cannot estimate ozone trends either from the global view of satellites or from the local view of a single ground station. The figure on the right gives ozone data at two different heights in the atmosphere and shows that ozone distributions have different trends depending on the altitude. The data shows that ozone levels are decreasing in the stratospheric ozone layer (have a look in the 'Higher Atmosphere' topic for more information on this) and increasing in the troposphere. Satellites see both the troposphere and the stratosphere at the same time. The data obtained, therefore, needs to be carefully interpreted to enable accurate representations of ozone trends at different altitudes in the atmosphere.
|
|
|
Related pages: The formation of ozone smog is explained in detail in:
|
scientific reviewer: Dr. Rolf Sander - Max Planck Institute for Chemistry, Mainz 2004-05-18 last published: 2004-05-24 |