> ACCENT en > No 1 May 2005 vegetation/CO2 > A: Activities
|
Download the Worksheet: PDF or Word document |
|
|
 |
Activities
CO2 uptake and release in nature
|
|
 T1 T1 |
Which major processes release CO2 to the atmosphere? Which take up CO2? Describe in three sentences and include the words:
assimilation - human - vegetation - combustion - animals and bacteria - dissimilation . |
|
_______________________________________________________________ |
|
_______________________________________________________________ |
|
_______________________________________________________________ |
|
_______________________________________________________________ |
|
_______________________________________________________________ |
|
_______________________________________________________________ |
|
 |
|
|
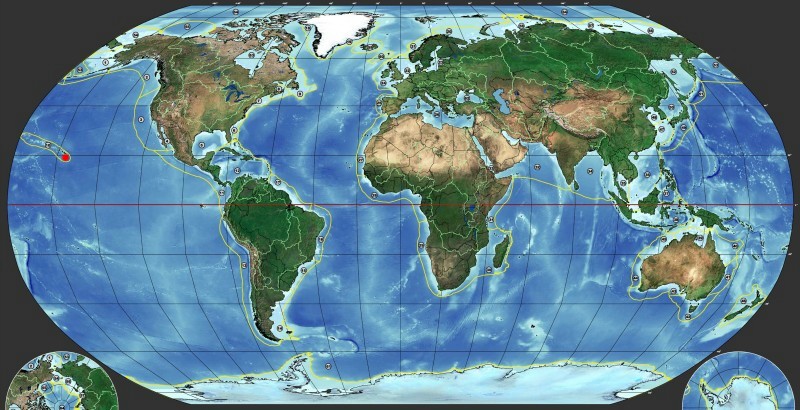
The world map of marine ecosystems and land vegetation (from NOAA).Click on the map for a larger view! (129 KB) Click here for a SUPERSIZE VIEW (1.2 MB)!
|
|
| T2 |
Above you see a world map. Compare the vegetation north of the equator (red line) and south of the equator. Where do you find more forest?
In which of the hemispheres do more people live and where is energy usage highest? Write a short answer. |
|
_______________________________________________________________ |
|
_______________________________________________________________ |
|
_______________________________________________________________ |
|
_______________________________________________________________ |
|
_______________________________________________________________ | |
|
|
|
CO2 variation
On the left you see a curve of CO2 variation measured in the Mauna Loa observatory in Hawaii in the Pacific Ocean. The location is marked with a red dot on the map above.
| T3 |
During which months of the year does the CO2 load of the atmosphere increase? During which months does it decrease? Why? Have a look on the parts of the curve marked in brown (A) and green (B) and give a short answer. |
|
|
_______________________________________________________________ |
|
_______________________________________________________________ |
|
_______________________________________________________________ |
|
_______________________________________________________________ | |
|
| T4 |
Estimate from the graph above the annual variation of CO2 in Hawaii. Give a number in ppm!
increase: ppm - decrease: ppm
Hawaii is located on the northern hemisphere. CO2 spreads over the whole globe, but exchange across the equator is (as for all gases) relatively slow. So the annual variation of CO2 in the southern hemisphere is different.
Question 1:
In which months of the year do you expect CO2 to increase in the southern hemisphere? Why? Question 2:
Do you think the annual variation of CO2 on the southern hemisphere is stronger or weaker than on the northern hemisphere? Why do you think so?
If you have problems to find an answer, please read also the ESPERE text on "distribution & concentration" of gases in the atmosphere (two paragraphs at the end): http://www.atmosphere.mpg.de/enid/3tf.html |
|
_______________________________________________________________ |
|
_______________________________________________________________ |
|
_______________________________________________________________ |
|
_______________________________________________________________ |
|
_______________________________________________________________ |
|
_______________________________________________________________ | |