 > ACCENT en > Nr 6 Feb. 2006 acid rain > R: Modeling impacts
|
Modeling sulphur dioxide emissionsAcid rain was a problem in Europe - it is a problem in Asia
|
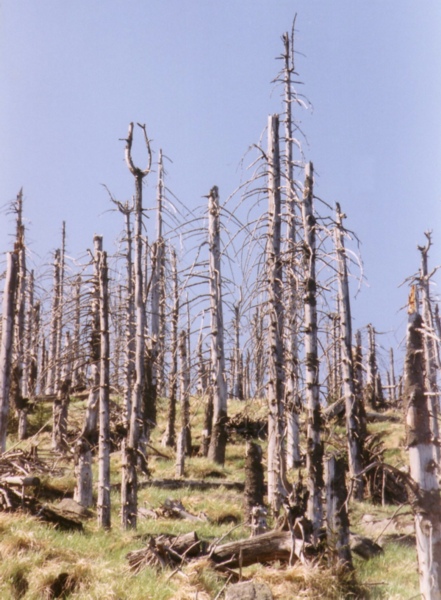
In the second half of the last century people in some regions in Europe became aware that the environment was being damaged by the strong acidity of rain or by acid fog. Naturally, rain is slightly acid because carbon dioxide dissolves in the rain droplets and the formed carbonic acid leads to pH-values of about 5.6. However, in regions with strong emissions of sulphur dioxide and nitrogen oxides to the air, values of pH = 4 or even less have been measured. As a consequence, soils became acidic and chemical compounds (like Al3+ ions) were mobilised, which damaged the forests. The pH value for example in Swedish lakes decreased significantly and many species in the ecosystems of the lakes died.
|
|
|
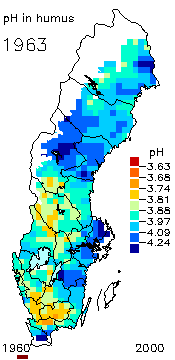
Not only the natural environment but also buildings and other cultural monuments sensitive to acids have been destroyed by the acid rain. In particular for sulphur dioxide and the sulphuric acid formed from it, the origin was combustion of sulphur containing fuels without filter technologies: brown and hard coal as well as oil-based fuels in power plants, industry and households. 2. On the left: The pH level in the humus layer in Sweden. The animation shows changes since 1963. Author: Ake Nilsson, Swedish University of Agricultural Sciences. Source: Swedish Environmental Protection Agency.
In recent decades, advanced filter technologies have been developed and laws have been passed forcing industry and electricity providers to use them. Many private households changed from coal briquettes to other energy sources for heating and cooking. Although many soils and lakes still suffer from acidification, sulphur emissions have been strongly reduced in Europe and the problem seems to be solved. |
|
However, in other parts of the world, especially owing to strongly expanding Asian industry with high energy needs but low environmental standards, acid rain became a severe problem. |
 |
|
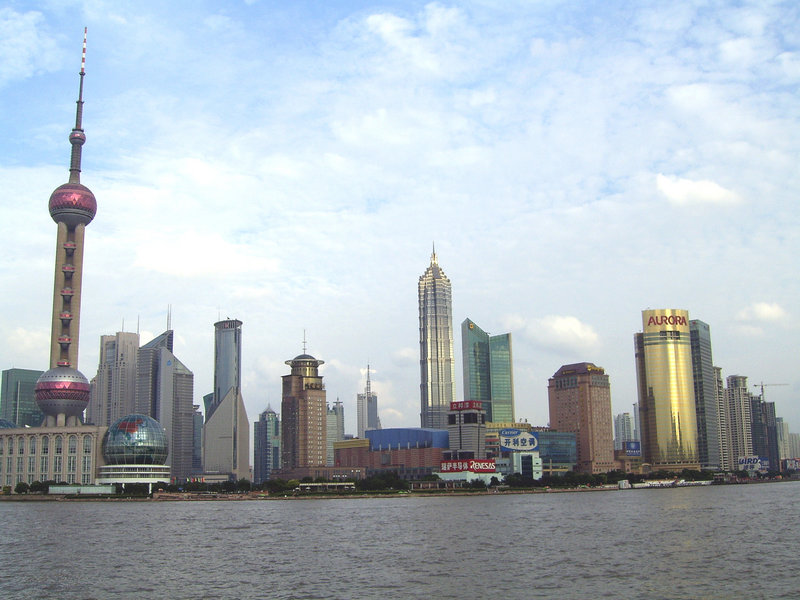
3. Pudong skyline of Shanghai; © Photo by Shizhao, copyright is granted under the GNU free documentation licence
|
|
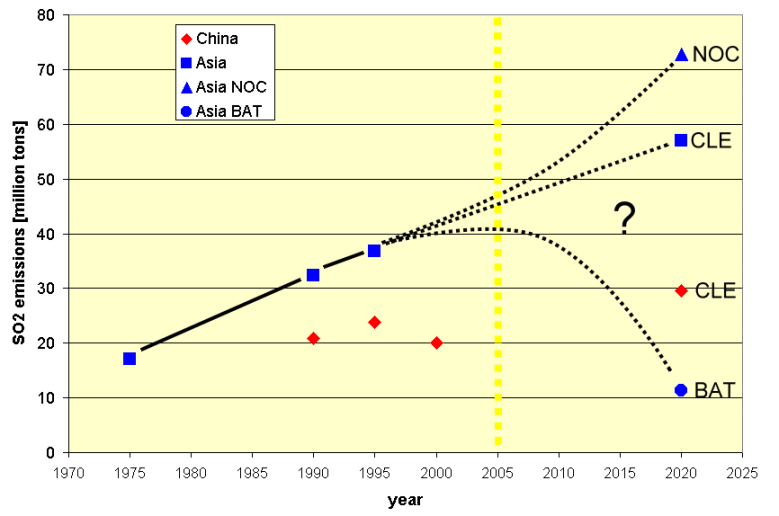
In countries like China much coal is available and is often cheaper than other energy sources. The economic benefits from low production costs and expensive filter technologies would increase these costs. Although it may pay off in the long term to protect the environment, investments have to be made now. In the International Institute for Applied Systems Analysis (IIASA) in Laxenburg (Austria), partner in ACCENT, a model (called RAINS) has been developed which estimates the present state, potential development and costs for mitigation of air pollution and acid rain in Asia.
|
|
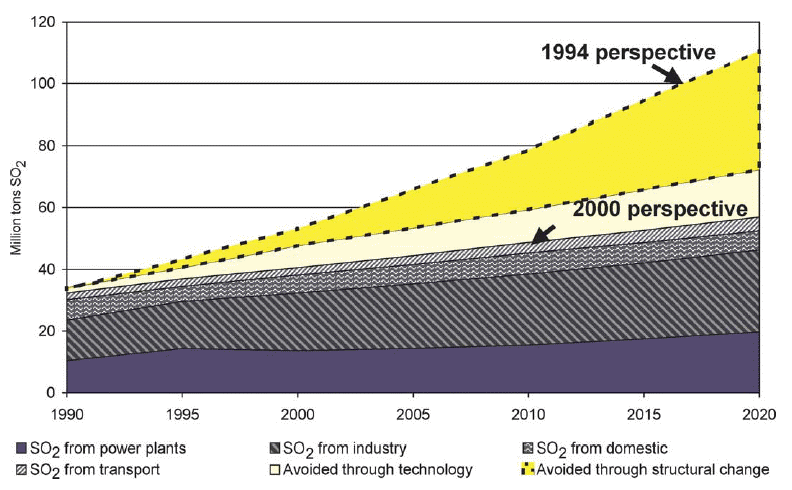
In 2004 it was estimated that coal combustion satisfies about 80% of the energy demand in the East Asian region. Although the relative fraction of other energy sources (oil, natural gas) may increase, the total energy demand is expected to double or triple within the next 30 years. Therefore, if the current legislation is not changed, sulphur emissions are still going to grow. However, the example of slight decline in emissions in China shows that raising awareness of the problem and respective measures in energy economy and policy can help to reduce the sulphur burden as they did in Europe. Therefore the "best available technology" scenario shows much lower values for 2020. |
|
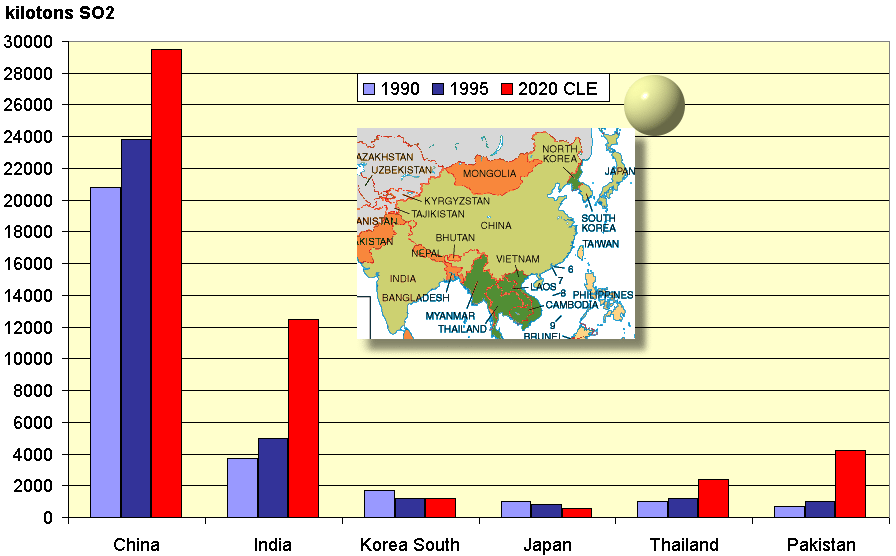
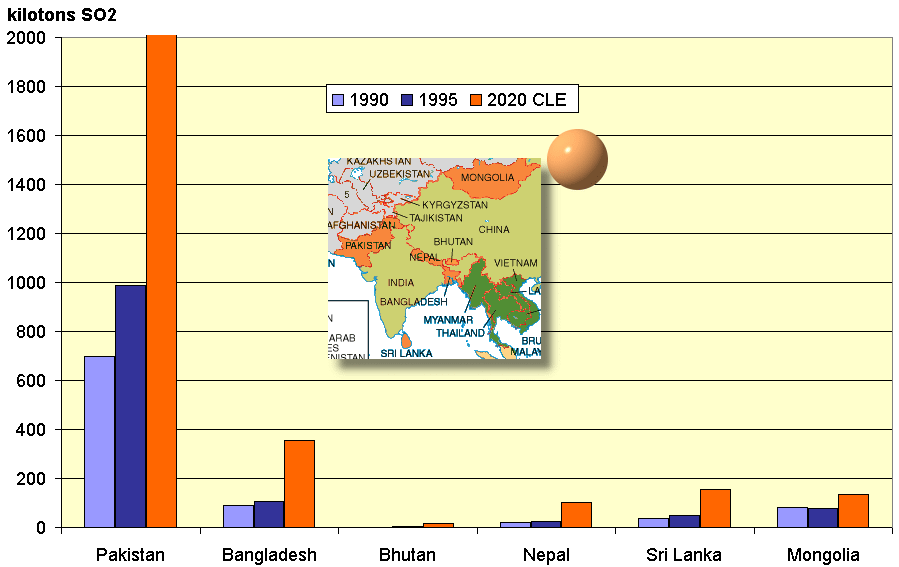
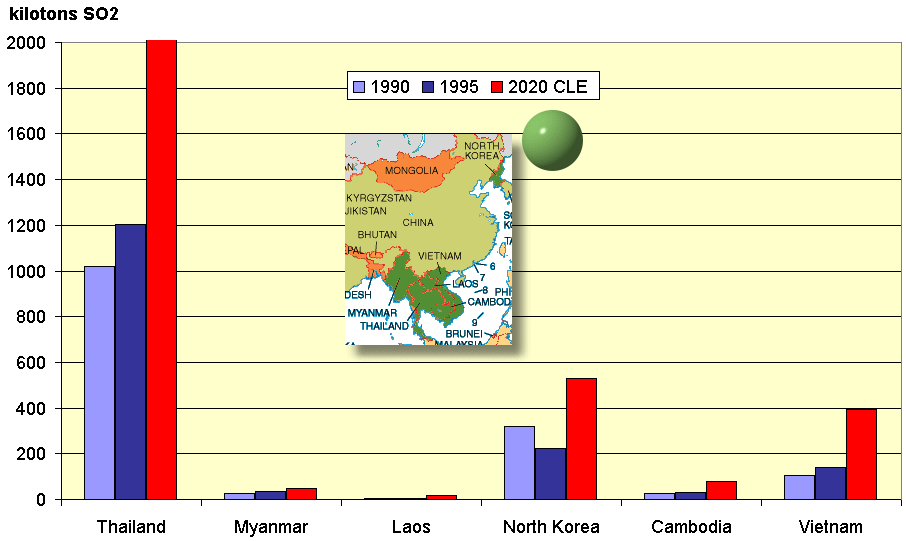
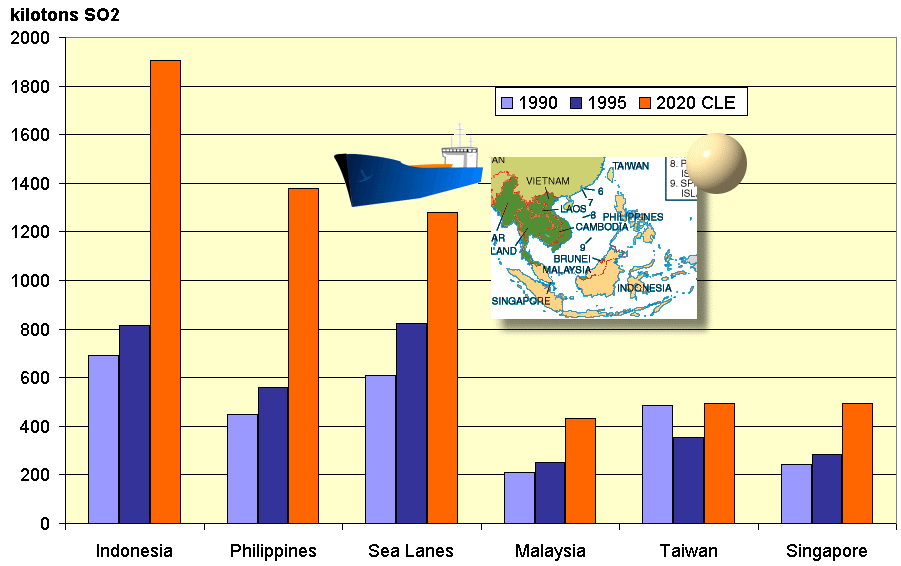
5. a - d) SO2 emissions by country in Asia. Estimation for 2020 are made according to a current legislation scenario (CLE). Please note that the scale range is by a factor of 15 larger for the big and economically strong countries in Asia in the chart top left. All other charts have the same scale ending at 2000 kilotons SO2. Since the estimations for 2020 are exceeding this range for Pakistan and Thailand, theses countries are also shown in chart a). |

|
|
|
|
Certainly emission control measures like modernisation of plants and integration of filter technologies are costly. The RAINS model also estimates costs. For example for the year 1995 it is estimated that 3.9 million tons of SO2 have not been released to the atmosphere thanks to investments in control technologies in the range of 4.7 billion USD. By 2020 it is estimated that according to the recent changes in legislation 28% of the theoretically uncontrolled emissions will be captured by costs of 13 billion USD. But for the ideal best possible reduction to 11 million tons (see graph BAT), 78 billion USD of costs are estimated.
|
|
|
These costs are not, a full loss for the economy of the countries because the development of filter and reduction technologies and their installation employs people and is part of the economy itself. For a single company, however, major investments owing to sharp legislation can be too expensive. Regulations have to be established in a wise way to keep short term and long term social, economical and environmental interests in a good balance. |
 |
|
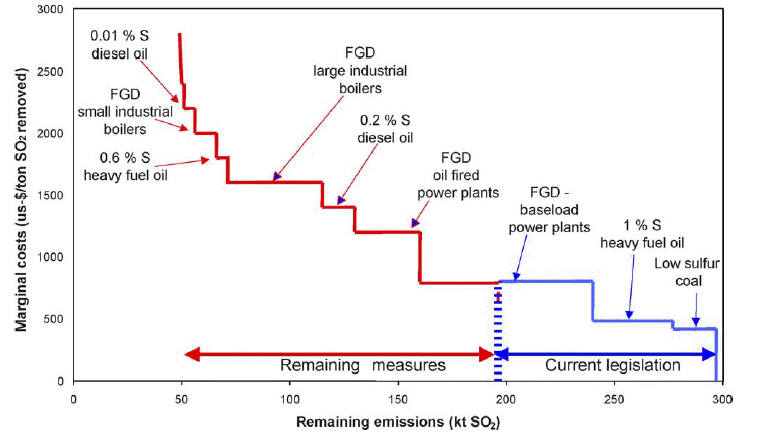
7. Costs for certain measures with large impact can be low, while they can be higher for other measures with smaller impact. Scientists and economists try to estimate where and how highest emission reduction can be most efficiently achieved by low costs. The graph shows how low sulphur coal and heavy oil and flue gas desulphurisation (FGD) can help to reduce emissions and in which parts of the energy system they can be applied by lowest cost with highest impact. For example, limiting the sulphur content in diesel oil to 0.2% has some impact on the emissions by moderate costs. To go further to 0.01% sulphur content in diesel has not much more impact but causes the same costs and is therefore much less efficient than for example flue gas desulphurisation in oil fired power plants.
|
|
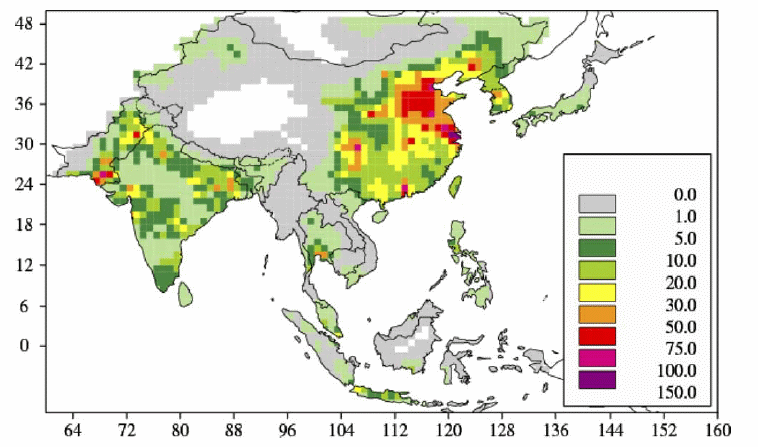
Often economic investments have to be made now for environmental benefits which pay off in many decades. In the case of acid rain however, the damage is more immediate. Not only for the environment but also for the health of the people. The World Health Organisation (WHO) recommends limits for acceptable air quality, which are in the range of c(SO2) = 15-20 µg/m3. The estimations of the RAINS model for 2020 however shows, that in wide urban areas 80 µg/m3 could be exceeded and local maxima could be even far higher. More than 1 billion people would live in the concerned regions. We can imagine that additional costs for health care would be enormous.
|
|
We learn from this that relatively simple chemical reactions like the formation of sulphuric acid from sulphur dioxide in the atmosphere have an enormous importance in the economy, policy, environmental protection and health care of large regions in our world. For damage to our society and environment to be avoided, scientists need not only to understand the chemical processes leading to emissions and the technologies to avoid them but also economic models are needed to consider which technologies should be applied first. |