 > ACCENT en > Nr 7 March 2006 Climate modeling > R: Global climate estimation
|
Climate scenarios for the 21rst century
The Intergovernmental Panel on Climate Change IPCC is a board of climate scientists, politicians and representatives of the economy. Every 5-6 years hundreds of authors from nearly all countries round the world agree on a report, which is organised by about 15 leading authors based on numerous key publications on processes contributing to our climate system and on model results. Such IPCC reports were published in 1990, 1995 and 2001.
|
|
For the next report of the IPCC (expected for 2007) several teams of climate modellers have been asked to calculate three "scenarios" for the future climate according to their best knowledge and using the available calculation capacities on super-computers for Earth system modelling. These computers are the largest in the world. One of the teams asked works in the Max Planck Institute for Meteorology in Hamburg, a partner in ACCENT. The results of their calculation will be compared with others. A summarising overview of all results will be shown in the IPCC report. But we can already have a look now at the estimations derived from the climate model in Hamburg. Please note, however, it is only one of 15 teams sending an estimation to the IPCC. |
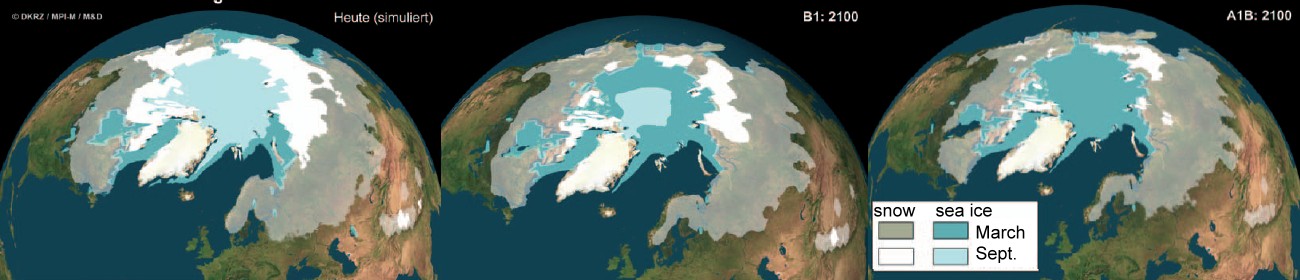
Global warming will continue, but not in all regions of the world to the same extent. The landmasses will warm up faster than the oceans. The most notable warming is expected for the northern latitudes and the Arctic regions. Already now we can observe that the Arctic ice, which melts in summer, is not formed anymore in the same volume in winter. By the end of the century the whole Arctic ocean could be ice-free in summer. 2. on the right: Increase of the average temperature on the world for the timespan 2071 - 2100 compared to 1961 - 1990. © MPI Met
|
|
|
The intensity of winter storms increases in Central Europe but decreases in the Mediterranean region. Owing to the warmer air, weather extremes will become more likely. Warm air can hold more water vapour. Therefore, precipitation will increase on average, but not homogeneously spread over the Earth. In humid climate zones like the tropics and mid- and northern latitudes it tends to increase, while the arid zones in the subtropics are becoming drier. |
|
|

|
This means the contrast between dry and wet climate zones becomes more pronounced. More severe droughts are expected for the Mediterranean region, South Africa and Australia. In the humid region the risk of heavy rain and floods increases. Winter snowfall decreases by 80-90% in most European countries by the end of the century (30-40% in the Alps and the Norwegian mountains). The length of dry spells increases world-wide. 5. on the left: Changes in precipitation for the period 2071 - 2100 compared to 1961 - 1990 for the months January and July. |
|
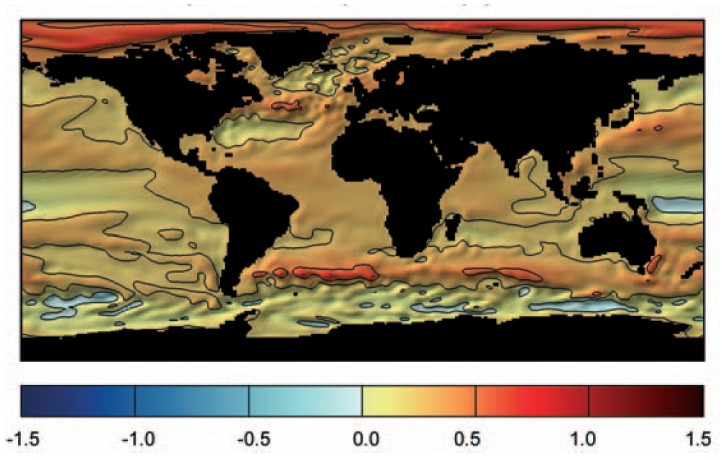
The ocean level may rise by 20-30 cm due to the thermal expansion. The melting of Greenland ice will be responsible for another 15 cm while heavier snowfall in Antarctica could lead to a reduction by 5 cm. The melting process in the Arctic causes a strong flux of freshwater into the salty Northern Atlantic ocean. This causes changes in the ocean circulation which is driven by differences in temperature and saltiness. The North Atlantic current could slow down and promote a cooler climate in Europe, which is however outweighed by the general warming trend.
|
|
Greenhouse warming has been masked in some way by air pollution which has prevented sunlight from reaching the Earth's surface. If strong measures are taken for the improvement of air quality world-wide this could lead to a rapid warming of almost 1°C in ten years. Table 1: The model runs are based on the following carbon dioxide (CO2) and sulphur dioxide (SO2) emissions: |
 |
|
Nowadays climate models also include sulphur emissions, which make a major contribution to air pollution, aerosol formation and backscattering of sunlight. This masks the global warming.The predicted further warming until 2100 will be in the range of 2.5 - 4°C on average.
|
The result of the model depends on the scenario the calculations are based on. The IPCC developed different scenario families for the future, which have been the basis for this calculation. They are called A1, A2 and B1 and they depend on different assumptions for the demographic, social, economic and technological development of our world.
|
|
|
The family A2 describes a heterogeneous development. Population and economic growth vary strongly in different regions in the world. Therefore the population continues to rise and the development in income per capita and technological change differ a lot and develop slowly. This scenario promotes climate change more strongly than the others. The family A1 describes a world with strong economic growth and a population reaching its maximum around 2050. The introduction of new technologies is quick and efficient. But the growth can be based on different resources: intensive use of fossil fuels (A1F), of non-fossil energy resources (A1T) or on mixture of both (A1B). Since the present trends go into the direction of an A1B scenario it is popular as an example. But certainly there is no guarantee how the world will develop in the coming decades. The family B1 assumes a population development like in A1 but the society will be very soon based on information technologies and services. The intensity of material and energy usage is reduced based on intelligent systems and sustainable policy and economy. Social balance and global justice increases but the scenario does not include specific climate protection programs.
|
|
The scenario B1 is the best for our climate but even in this case the CO2 level will reach about 550 ppm at the end of the century, which is a doubling compared to the pre-industrial value of 280 ppm. 9. on the left: CO2 mixing ratios - observed from 1850 - 2000 and estimated for different IPCC scenarios until 2100.
|
|
Author: Elmar Uherek - Max Planck Institute for Chemistry, Mainz
|