 > ACCENT en > Nr 10 Sept. 2006 Africa's emissions > R: Domestic fire emissions
|
Domestic Biomass Burning in Africa
About half of the world’s population is using fuels from biomass as an energy source in the private household: for cooking, lighting and heating. The energy sources are fuelwood, agricultural residues (for example maize cobs or rice straw), charcoal or cow dung. This practice has consequences for the people and the environment: |
 |
|
1. Domestic fires concern people and the environment in several ways:
|
In many cases the stove is located in the hut and because of insufficient ventilation the released toxic gases like carbon monoxide (CO) and nitrogen oxide (NO) as well as dust particles become health risks. |
|
|
According to very rough estimations, annual emissions from domestic fires are in the range of 17% (1500 Tg CO2-C), 13% (140 Tg CO-C) and 6% (2,5 Tg NO-N)* respectively for these three gases compared to the total global emissions. However, it has to be mentioned that most of the carbon dioxide is from renewable sources**. This is 100% the case if agricultural residues and dung are burnt. It is often the case if wood is burnt, but not if forests are cut and do not regrow. |

* With the decription CO2-C we express that only the carbon content in the carbon dioxide is mentioned. Each molecule CO2 has 44 mass units of which 12 are carbon and 32 oxygen. Consequently a mass of 1500 Tg CO2-C is equivalent to a mass of 5500 Tg carbon dioxide.** With renewable resources we mean that a plant which dies and is burnt or decomposed in other ways releases carbon dioxide to the air. But if the same plant grows again during the following years at the same place, it takes up again the same amount of carbon dioxide from the air in order to grow. The long term net budget is nearly zero. |
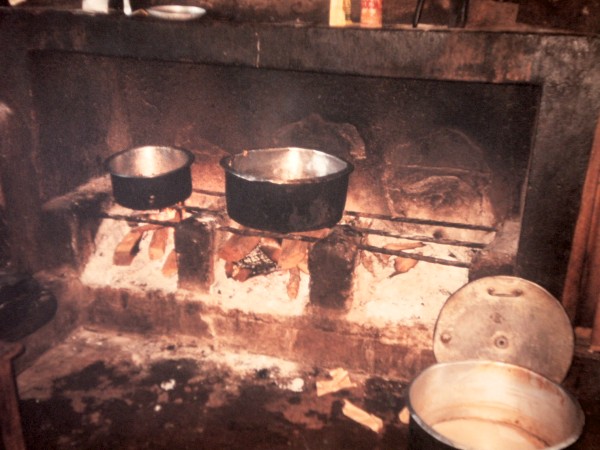
Researchers visited between 1995 and 1999 households in the African countries Kenya and Zimbabwe and tried to get an overview about the common practice. Looking over their shoulders we do not only get an idea how much (or how little) energy African households use up, we also get an impression of daily life. In rural regions no electricity is available and fuelwood is the most important energy source. In the cities houses often have electricity and also the supply with other burning material like kerosene is more secure. But often electricity is only used for lighting and kerosene only when there are no alternatives, since both resources are regarded as expensive and the average citizens are poor. Kerosene and liquid gas seem to be more modern and cleaner energy sources. What do the locals say and why they are hardly used? |
|
|
Statements of the locals concerning kerosene and liquid gas:
|
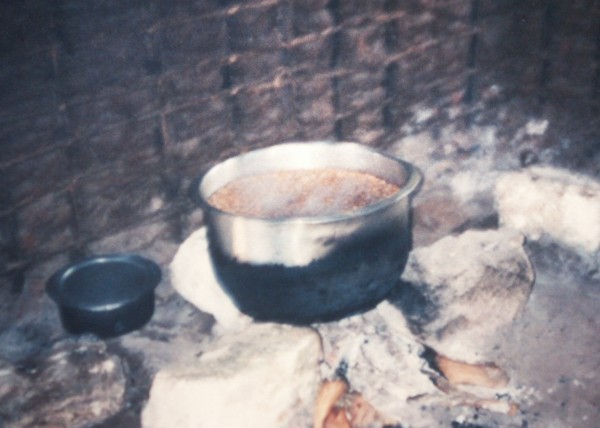
What do we need to know in order to estimate the consumption of fuelwood in a country like Kenya and Zimbabwe? Here a few key questions: - What sort of stoves are typically used and what are their emission characteristics? - How much fuelwood does a typical family gather? |
|

|
- How many alternative energy sources are used? For example agricultural residues like maize cobs or other energy sources like charcoal. 7. on the left: Charcoal production in Kenya. Charcoal is lighter than fuelwood and more suitable if longer transportation is necessary. This is in particular the case in densly populated regions and cities. |
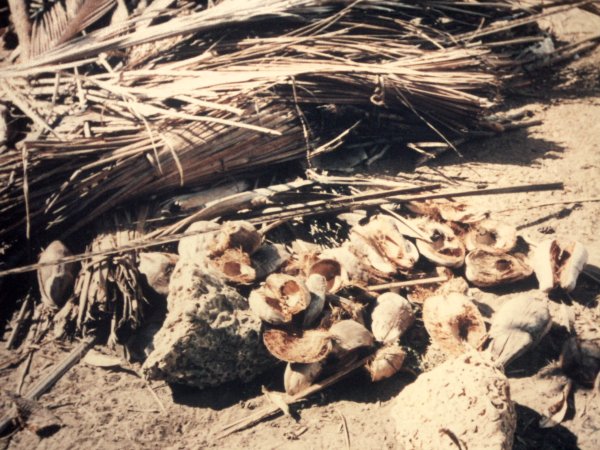
- What is the seasonal dependence of fuel resources? Agricultural residues in particular are only available in certain seasons. A questionnaire in another season can lead to a completely different result. 8. on the right: Besides maize cobs, coconut shells and palm leaves are also used in the stove. |
|
|
- What is the relation of the population density to fuelwood availability. In regions where fuelwood is not scarce the fires tend to burn longer, also after cooking. on the left: 9. Household size versus fuel consumption. The graph demonstrates the decreasing consumption per capita with increasing household size. Source: Marufu et al., Domestic Biomass Burning in Rural and Urban Zimbabwe - Part A, 1996
|
|
Fuelwood consumption has been estimated from concrete measurements and a questionnaire in 2200 households in Kenya in 1997 from January to March. A rural household used up about 0.8 to 2.7 kg (average 2.14 kg) firewood per capita and day. The firewood is the main energy source. The average charcoal consumption was 0.26 kg per capita and day. Additionally the rural households used about 0.32 kg per capita and day material from maize cobs. |
|
Urban households rely primarily on charcoal and use up about 0.2 to 0.7 kilograms per capita and day (average 0.37 kg), but only 0.1 – 0.5 kg (average 0.14 kg) firewood. They also make use of other more advanced energy resources, but not of plant residues. However, although 62% of the permanent households in the cities had electricity, most of them did not use it for cooking. |
Generally towns are densely populated and the citizens cannot gather firewood next door but buy energy resources on the market. Charcoal has a much higher energy content per weight than wood has and it is more convenient to transport it to the towns. But charcoal is made from wood and with respect to the total production process it is more efficient to burn wood directly if the transport is not relevant. Towns are also often connected to the electricity network, while farms and little villages are not. Instead small villages have easy access to plant residues from the fields during certain seasons. These are the main reasons for different consumption behaviours in rural and urban regions. |
|
|
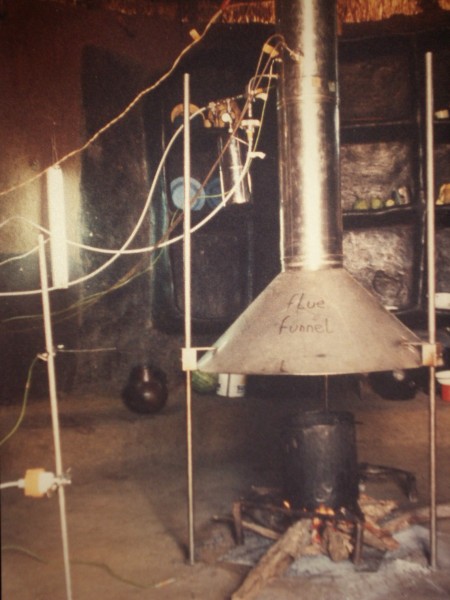
Emission studies: In order to estimate the emissions from a wood fire in a stove we need to know the typcial burning behaviour of a fire. The following graphs show the periods of a typical fire and the respective emissions. |
Comparable studies are not available for all countries in Africa and it is difficult to conclude from such studies on the energy and fuel consumption of the whole African continent or even other regions in the world with domestic biomass burning. |
|
|
|
Plant residues are, however, not available all year long and people are reluctant to admit to using cow dung, because it is regarded as a sign of extreme poverty. Moreover, in Zimbabwe charcoal is not used at all. Later on, the study was extended to more than one year from January 1996 to March 1997 and to different landscape types and towns in Zimbabwe. |
|
The long term consumption was estimated to be 1.3 tonnes of fuelwood per capita and year (3.6 kg / day) and 0.07 tonnes of plant residues (0.2 kg / day) in rural areas. Consequently, it can be said that the much higher plant residue consumption was only observed during the respective season. |
|
|
|
Although Zimbabwe cannot represent all African countries we can learn from the available data about the basic energy usage in less developed Africa (the Mediterranean coast and the Republic of South Africa have much higher energy consumptions). |
The following emissions from domestic cooking fires are estimated for Zimbabwe. In brackets the contribution to the total emission of the country is given.
|
|
|
This means the people in Zimbabwe consume 4.6 Tg = 4.6 million tonnes CO2-C (16.9 million tonnes CO2) in domestic fires, which is 41% of the 41 million tonnes of CO2 consumed in total. These are 3.65 tonnes of CO2 per capita in total, and 1.5 tonnes per capita in domestic fires.
|
|
Such numbers such as 3.65 tons CO2 per capita and year in Zimbabwe are not necessarily in agreement with official data from energy agencies, who publish for example about 1 tonne per capita and year for Zimbabwe. But in most cases data of private firewood usage are just not available and calculations have to rely on the consumption of oil products. On the other hand, since firewood is at least partially a renewable primary product, it can also not be directly compared to CO2 emissions from fossil fuel consumption in industrialised countries. Therefore the uncertainty about the contribution of African countries to the greenhouse effect is high. |
Author:
The material for the articles research and context of this edition is based in particular on the book "Climate change and Africa" edited by Pak Sum Low (2005) and field studies carried out by Lackson Marufu and Evans Kituyi in Zimbabwe and Kenya, in cooperation with the ACCENT partner MPI Mainz. Most of the photos shown here have been taken during these field studies which took place in 1996 and 1997. Furthermore we thank Dr. Günter Helas from Max Planck Institute in Mainz for providing the publications and the advice during the development of this edition. |