> ACCENT en > Nr 4 Oct. 2005 light/satellites > R: The view from space
|
|
 |
SCIAMACHY - A new technology in space
gives us a three-dimensional impression
of ozone values.
|
 |
|
|
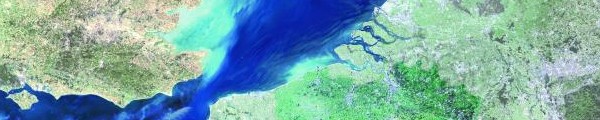
1. The English Channel - ENVISAT has been delivering photos from space as well as ozone values since 2002.
|
 Into space Into space
On March 1st 2002, an Ariane 5 rocket took off from the Kourou space centre in French Guiana (North coast of South America). On board she had a satellite weighing 8 tons, ENVISAT. A little instrument on board this colossus is called SCIAMACHY (SCanning Imaging Absorption spectroMeter for Atmospheric CHartographY; www.sciamachy.de).
SCIAMACHY now makes it possible to get even more information than ever before about our atmosphere from space. It is also observing our ozone layer.
|
|
 |
|
|
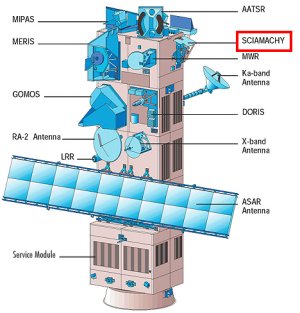
2. ENVISAT serves as a platform for numerous observation and research projects. SCIAMACHY is only one small part of the whole technology on the satellite and the ozone measurements are just one of the features SCIAMACHY has. © ESA
Please click the picture in order to enlarge it. (80 K)
|
|
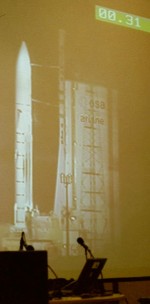
| | Scientists of the Institute for Environmental Physics and Remote Sensing at Bremen are partners in ACCENT. They contributed to the development of SCIAMACHY and supervise the measurements. After many years of development work all eyes are glued to the big screen as they watch the launch of the rocket during the 'Bremen Space Night'.
3. Photo on the left:
The Ariane 5 rocket on the big screen: 31 Seconds until take-off © IUP Bremen
| |  | | 4. Suspense before the start during the simulcast from Kourou © IUP Bremen
For decades the ozone layer has been observed from space. In October 1978 the history of satellite based monitoring of the ozone layer began with the Nimbus-7 satellite from NASA and the first version of the 'Total Ozone Mapping Spectrometer' TOMS.
|
|
| | | | | |
SCIAMACHY had a predecessor in Bremen: the 'Global Ozone Monitoring Experiment' GOME. However, SCIMACHY is scanning a by far wider range of the electromagnetic spectrum than GOME and sees much more than the human eye.
|
 |
|
|
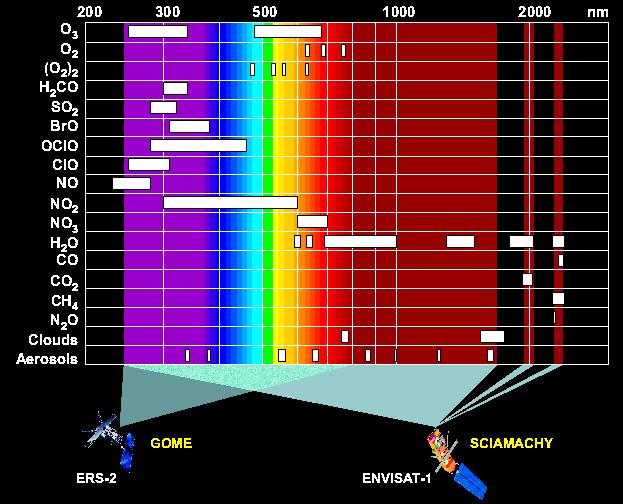
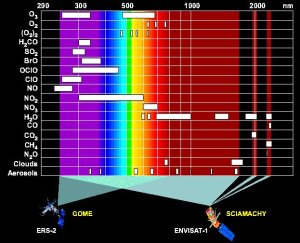
5. The measurement range of SCIAMACHY includes a wide area of different wavelengths, suitable for the monitoring of diverse chemical compounds. © IUP Bremen
Please click the image for a full view. (60 K)
|
|
|
What we perceive with our eyes and call light is from the physical point of view electromagnetic radiation. Beginning with violet via blue green yellow orange and red the energy of this radiation decreases. SCIAMACHY also observes the energy rich ultra-violet light (beyond the violet) and the energy poor infrared light (beyond the red).
A lot of molecules take up light in this range of wavelengths (absorption), which therefore does not reach the instrument. From the amount of absorbed light we can work out the concentration of molecules in the air (given below for ozone in trillion (1012) molecules per cm3).
|
Three dimensional information
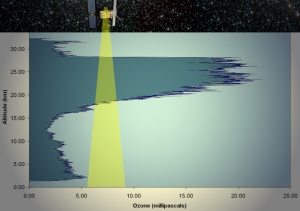
The amount of ozone molecules is notably high in the so called ozone layer at altitudes between 15 and 35 km above the Earth surface. But there is also ozone near the ground, and in summer sometimes more than we would like to have.
|
The eye in space however sees the whole amount of ozone (the ozone column) between the satellite and the Earth surface at once, the 'good' ozone in the ozone layer and the sometimes problematical ozone near the ground. TOMS and GOME could deliver ozone values for the whole Earth surface. But they could not differentiate the altitude at which the ozone was located. SCIAMACHY is able to deliver more.
|
|
 |
|
|
6. Total view of a satellite on the ozone profile in all altitudes.
Ozone profile: University of Michigan; compositon: Elmar Uherek
Please click the image for a full view! (90 K)
|
|
|
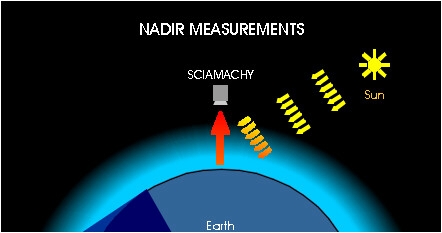
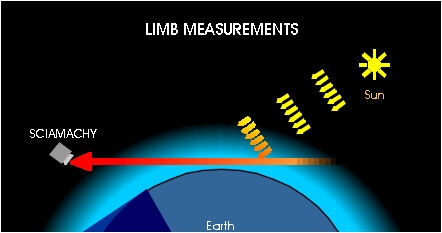
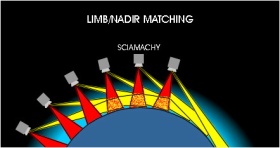
The magic words are 'Nadir' and 'Limb'. They stand for the different points of view the instrument has during measurements. In the NADIR mode the atmosphere below the satellite is scanned. In the LIMB mode the instrument sees through the atmosphere tangentially to the Earth's surface.
|
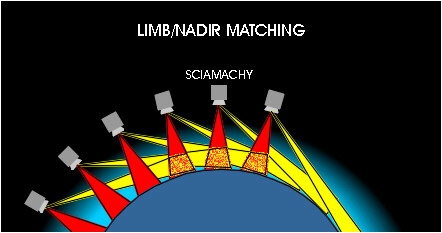
About 7 minutes after a measurement in the LIMB mode has been carried out, the same section of the atmosphere can be measured in the NADIR mode. In this way a three dimensional image of the ozone concentration in the atmosphere can be calculated.
All images can be enlarged by clicking on them. (30 - 40 KB)
|
|
 |
|
|
9. Nadir-Limb-Matching: successive measurement of the same part of the atmosphere in both modes © IUP Bremen
|
|
SCIAMACHY measurements
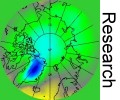
The coloured diagrams below show processed results from SCIAMACHY measurements for September 30th 2004 and March 30th 2005. A nearly pole-to-pole cross section of the atmosphere is shown as well as the density of ozone molecules over the Antarctic and Arctic at four different altitudes.
|
|
|
|
10. Data for 2004-09-30
With the onset of Antarctic spring the ozone hole becomes visible. In particular, around the pole and in a sector between 300° and 0° the number of ozone molecules per cm3 of air is very low. |
|
|
|
15. Data for 2005-03-30
The ozone decrease in Arctic spring is clearly less distinct. However, sometimes also the layer here thins significantly which causes a high burden of UV-light for Northern and Central Europe and Canada. |