 > ENC Master > Climate Encyclopaedia > Weather > more > 2. Major wind systems > - El Niño & SOI
 |
|
|
|
WeatherMore |

Southern Oscillation & El Niño historySouthern OscillationThe fluctuations in ocean temperatures during El Niño and La Niña are linked with an even larger-scale fluctuations in air pressure between the western and eastern tropical Pacific known as the Southern Oscillation.
|
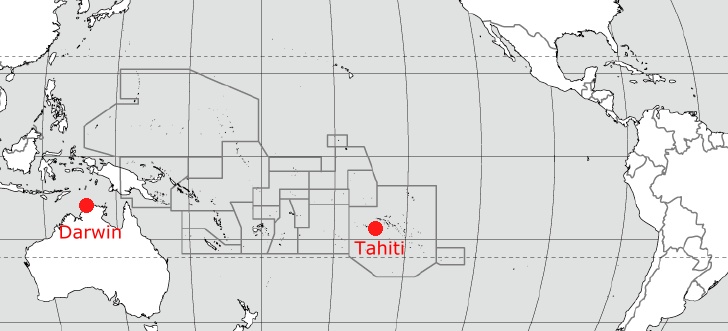
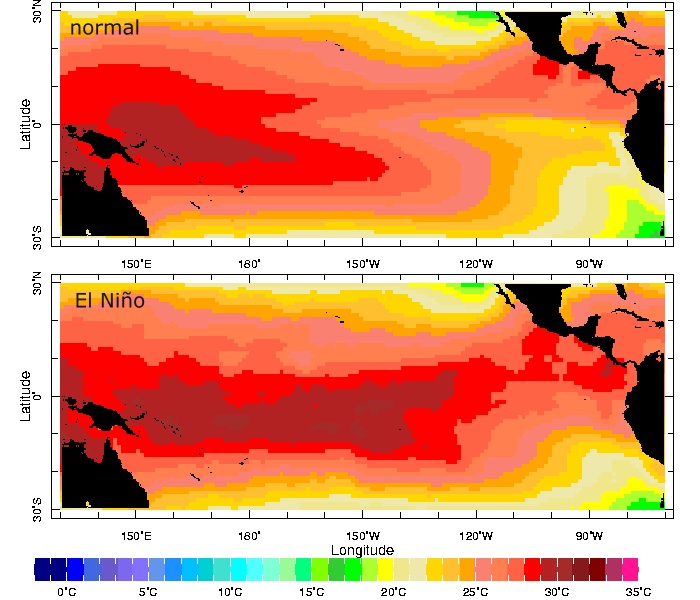
The Southern Oscillation is a change in air pressure measured between the eastern (Tahiti) and western (Darwin) parts of the Pacific. When the pressure is high at Darwin it is low at Tahiti and vice versa. El Niño, and its sister event "La Niña" represent the opposite extreme phases of the southern oscillation. During El Niño higher than average air pressure covers Indonesia and the western tropical Pacific and below-average air pressure covers the eastern tropical Pacific.
|
|
|
These pressure departures are reversed during La Niña, which features below-average air pressure over Indonesia and the western tropical Pacific and above-average air pressure over the eastern tropical Pacific.
|
|
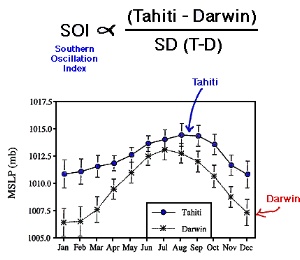
Southern Oscillation Index (SOI)The Southern Oscillation Index (SOI) is designed to measure the strength and phase of the Southern Oscillation. During El Niño episodes the SOI has a large negative value due to lower-than-average air pressure at Tahiti and higher-than-average pressure at Darwin. During La Niña episodes the SOI has a positive value due to higher-than-average air pressure at Tahiti and lower-than-average pressure at Darwin. El Niño episodes occur in every 2-7 years. |
 |
|
3. The southern oscillation index SOI. Strong negative red values stand for El Niño events, strong positive blue values stand for La Niña conditions. Please click the graph for a higher resolution.
|
 |
|
4. Sea Level Pressure 1960-1984
|
Historical review on El Niño eventsEl Niño is not a new phenomenon, it has been around for thousands of years. Chemical signatures of warmer sea surface temperatures and increased rainfall caused by El Niño appear in coral specimens at least 4000 years old, but some researchers claim to have found coral records that hold evidence of El Niño cycles more than a 100,000 years ago!
|
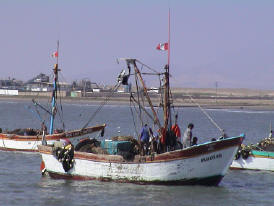
The records of El Niño date back as far as the 1500s. At that time fisherman off the coast of Peru started noticing that periodic warm waters hold down their anchovy catch. But also peruvian farmers noticed that the warm waters lead to increased rainfall, transforming normally barren areas into fertile farmland. In the period of 1700-1900 European sailors made sporadic attempts at documenting the phenomenon, hence scientists become interested in identifying it's cause.
|
|
|
Still, until the middle of the 20th century, little was known about conditions during El Niño years. Interest intensified in the late 1960s and early 1970s, and using new observations including satellite data, climatologists and oceanographers recognized that El Niño meant a whole lot more than just a local feature of climate variability. Only from that time were the major elements of this climate oscillation linked together.
|
|
| |||||||
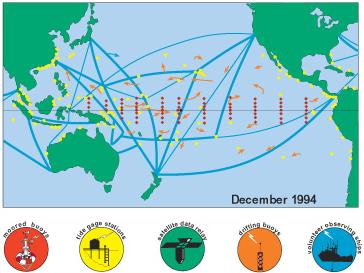

6. Nowadays the Pacific Ocean is observed by fixed Atlas buoys, measuring several parameters, also in deeper water layers, by coastal tide gauge stations, by satellites from the space (sea surface temperature), by drifting buoys and research ships. From this data an El Niño early warning system helps the people to be ready for the next event.
|
|
|
|
In the period of 1982-83, the strongest El Niño ever recorded made havoc around the world. Related floods,droughts & wildfires killed about 2,000 people worldwide. Damage is estimated at $13 Billion. In 1997-1998, an El Niño more powerful than the record 1982-83 event developed in the pacific. Warnings were issued in mid 1997, and emergency preparedness conferences were convened. By March 1998, El Niño-related events globally caused US$34 billion direct loss, and killed 24 thousand people. 111 million people were affected in any way, and the related events left 6 million displaced people behind them.
|
About this page:author: Vera Schlanger - Hungarian Meteorological Service |
|
Further reading: http://whyfiles.org/ http://ww2010.atmos.uiuc.edu/ http://www.oc.nps.navy.mil/ http://cpc.ncep.noaa.gov/ http://www2.sunysuffolk.edu/
|