|
|
 |
|
|
|
|
| |
|
|
|
Weather
More |
The Southern Oscillation and El Niño
Southern Oscillation
The fluctuations in ocean temperatures during El Niño and La Niña events are linked to even larger-scale fluctuations in air pressure between the western and eastern tropical Pacific known as the Southern Oscillation.
|
|
|
|
|
|
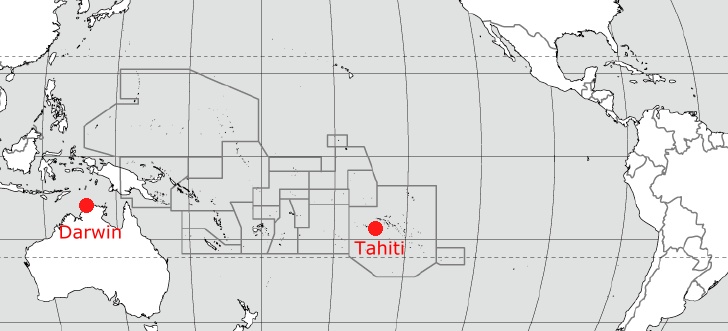
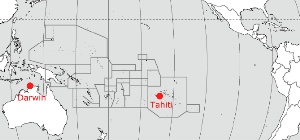
The Southern Oscillation is a change in air pressure measured in the Pacific Ocean between Tahiti in the east and Darwin, Australia in the west. When the pressure is high at Darwin, it is low at Tahiti and vice versa.
El Niño, and its sister event "La Niña" represent the opposite extreme phases of the Southern Oscillation. During El Niño events higher than average air pressure covers Indonesia and the western tropical Pacific and below average air pressure covers the eastern tropical Pacific.
|
|
 |
|
|
1. Map of the South Pacific, showing Darwin in Australia and Tahiti, one of the Pacific Islands
Please click the map for a higher resolution! (60 K)
|
|
|
These pressure departures are reversed during La Niña, which features below-average air pressure over Indonesia and the western tropical Pacific and above-average air pressure over the eastern tropical Pacific.
To sum up:
- El Niño refers to the oceanic component of the El Niño/Southern Oscillation (ENSO) system
- The Southern Oscillation refers to the atmospheric component
- ENSO is the coupled ocean-atmosphere system
ENSO has 3 phases: a warm phase known as El Niño, a cold phase called La Niña and neutral phase when neither El Niño or La Niña conditions occur.
|
 |
|
|
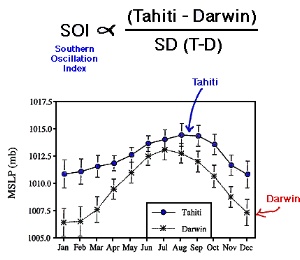
2. The normal mean sea level pressure (MSPL) at Tahiti is higher than at Darwin. If the pressure at Darwin rises relative to Tahiti the SOI becomes negative and we have an El Niño event.
source: Climate System Lectures, Univ. of Columbia, NY
|
|
|
Southern Oscillation Index (SOI)
The Southern Oscillation Index (SOI) is a measure of the strength and phase of the Southern Oscillation. During El Niño episodes the SOI has a large negative value due to lower-than-average air pressure at Tahiti and higher-than-average air pressure at Darwin.
During La Niña episodes, the SOI has a positive value due to higher-than-average air pressure at Tahiti and lower-than-average air pressure at Darwin.
El Niño episodes occur in every 2-7 years.
|
 |
|
|
3. The southern oscillation index SOI. Strong negative red values stand for El Niño events, strong positive blue values stand for La Niña conditions. Please click the graph for a higher resolution.
Source: Long Paddock website, Gov. of Queensland
|
 |
|
|
4. Sea Level Pressure 1960-1984
source: U. S. Army Topographic Engineering Center
|
Historical review on El Niño events
El Niño is not a new phenomenon, it has been around for thousands of years. Chemical signatures of warmer sea surface temperatures and increased rainfall caused by El Niño appear in coral specimens at least 4000 years old, but some researchers claim to have found coral records that hold evidence of El Niño cycles more than a 100,000 years ago!
|
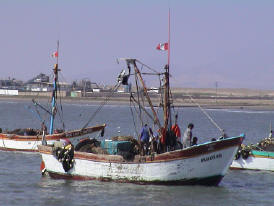
Records of El Niño events date back as far as the 1500's. At that time fisherman off the coast of Peru started noticing that periodic warm waters resulted in low anchovy catches. However, Peruvian farmers also noted that the warm waters lead to increased rainfall, transforming normally barren areas into fertile farmland.
Between 1700 and 1900 European sailors made sporadic attempts at documenting the phenomenon and scientists became interested in identifying the cause.
|
|
 |
|
|
5. Fishermen off the coast of Peru. Warm waters during El Niño events reduce the number of fish along the Peruvian coast causing reduced fish catches.
© downtheroad.org - Peru
|
|
|
It wasn't until the middle of the 20th century that the scientific causes of ENSO were worked out. Interest increased in the late 1960's and early 1970's and, using new observations including satellite data, climatologists and oceanographers recognised that El Niño events were much more than just a local feature of climate variability.
|
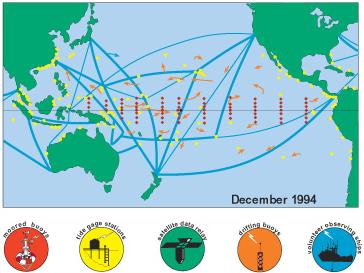
6. Nowadays we record conditions in the Pacific Ocean using fixed Atlas buoys which measure lots of different parameters, both at the surface and at depth. We also use drifting buoys, research ships, coastal tide gauge stations and make measurements of sea surface temperature from space using satellites. All this data forms an El Niño early warning system which helps people prepare for the next El Niño event.
© clivar.org
In 1923, a British Scientist, Sir Gilbert Walker discovered that when air pressure is high in the Pacific, it is low in the Indian Ocean from Africa to Australia, and vice versa. His findings, which he named the Southern Oscillation, were the first indication that weather conditions in distant parts of the tropical Pacific region are connected.
Fifty years later, in the late 1960's, Jacob Bjerknes a Norwegian meteorologist and Professor of the University of California at Los Angeles came up with the first detailed description of how El Niño works. He made the connection between Walkers Southern Oscillation and El Niño and this is now officially known as the El Niño/Southern Oscillation or ENSO for short.
|
 |
|
|
8. a) Please click to see an animation of the Walker circulation over the Pacific. The image shows the circulation for neutral conditions.
© original: Bildungszentrum Markdorf
|
|
|
 |
|
|
8. b) Please click on this image in order to see what changes during El Niño conditions.
|
|
 |
|
|
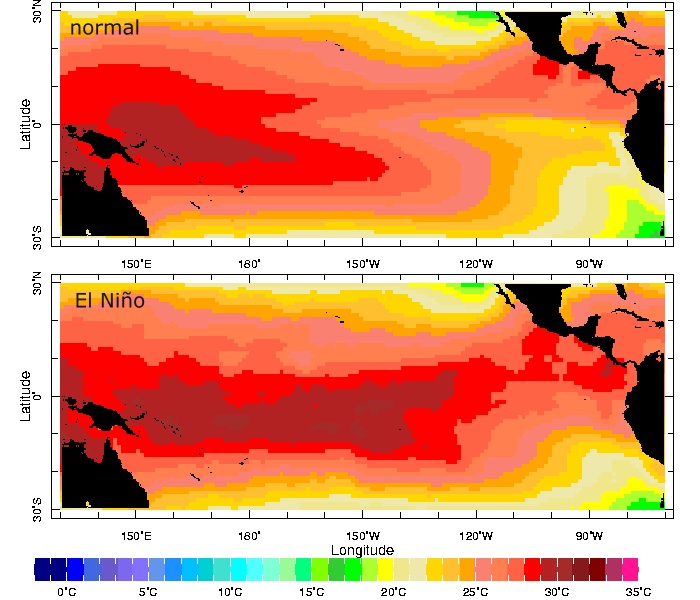
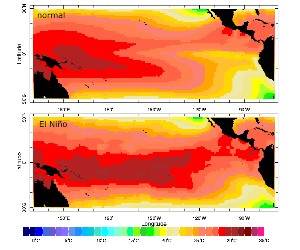
9. Comparison of the absolute sea surface temperature for normal conditions and the El Niño event in 1982.
source: Climate science lecture, Univ. of Columbia, NY - Please click to enlarge! (120 K)
|
|
|
El Niño events and consequences
Between 1982 and 1983, a very strong El Niño caused havoc around the world. Associated floods,droughts & wildfires killed about 2,000 people worldwide. The damage caused was estimated at US$13 billion.
An even stronger El Niño event developed in the Pacific between 1997 and 1998. Warnings were issued in mid 1997 and emergency preparedness conferences were convened. By March 1998, El Niño-related events globally caused US$34 billion of direct losses and killed 24,000 people. 111 million people were affected in some way and the related events left 6 million displaced people behind them.
|
|
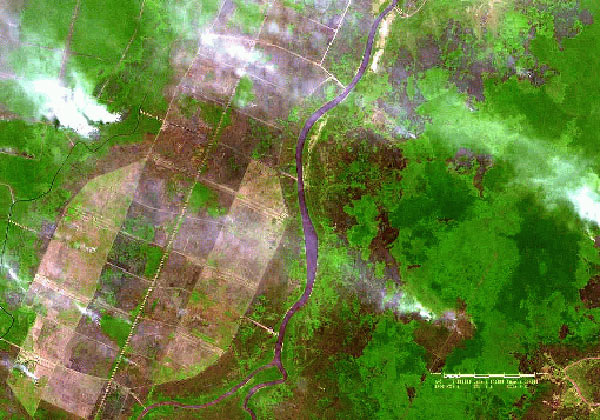
Floods and fires are often a consequence of El Niño events. Smaller bush fires are normal in shifting cultivation areas, such as Indonesia. But sometimes it is also industrial burning, i.e. burning forest areas to enlarge plantations. Normally the heavy rain in December extinguishes all fires. But under El Niño conditions there is no rain.
Look at the following pictures what severe drought conditions mean.
|
|
La Niña, on the other hand, can mean lots of rain in the following areas: South Asia (during monsoon times), North and North East Australia, South Africa, Northern South America, Central America, Hawaii.
|
About this page:
author: Vera Schlanger - Hungarian Meteorological Service
last paragraph added 2005-07-19, author: Julia Heres
scientific reviewing: Dr. Ildikó Dobi Wantuch / Dr. Elena Kalmár - Hungarian Meteorological Service, Budapest
last updated: 2005-07-19 |
|
Further reading:
http://whyfiles.org/
http://ww2010.atmos.uiuc.edu/
http://www.oc.nps.navy.mil/
http://cpc.ncep.noaa.gov/
http://www2.sunysuffolk.edu/
|
|
|
|