 > ACCENT en > No 1 May 2005 vegetation/CO2 > R: Monitoring carbon dioxide
|
Monitoring the fever chart of atmosperic carbon dioxide |
 |
|
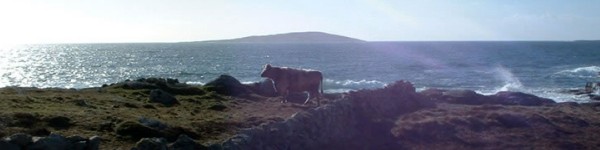
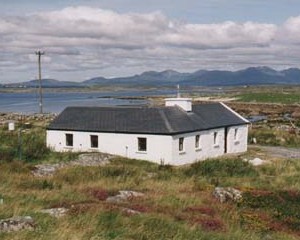
1. 1. Mace Head - Atmospheric watch at the Irish ocean shore - Photo by Tim Lueker, SIO |
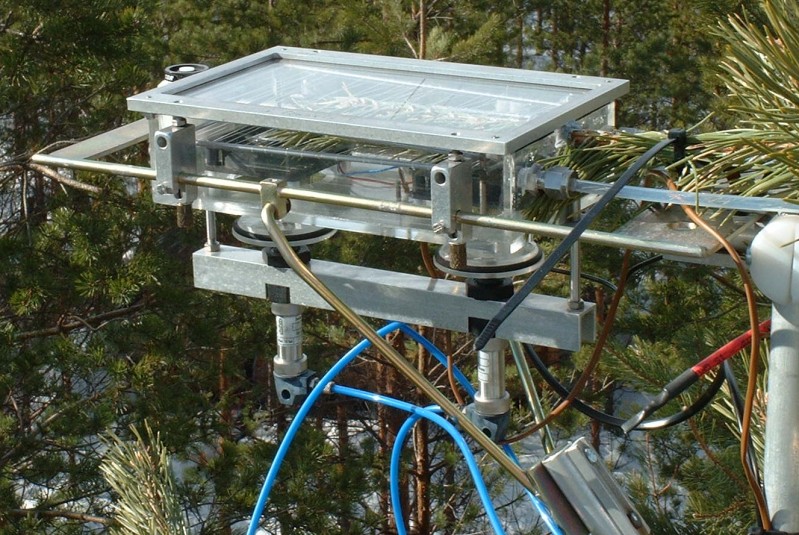
On the west coast of Ireland, at the north end of Galway Bay, you will find at a lonely place in the landscape a cottage and some masts around. It could be the home of a shepherd, but is in fact packed with instruments for atmospheric research. Here, carbon dioxide is measured continuously and additionally samples are taken weekly in 2L or 2.5L glass flasks for external analysis.
|
|
|
The concentration of carbon dioxide is determined by analysis in the NOAA Climate Monitoring and Diagnostics Laboratory (CMDL) in Boulder, Colorado (USA) by gas chromatography. This reference laboratory compares the results with other laboratories worldwide. Analysis of flasks from Mace Head is also carried out in a laboratory in France using mass spectrometry. The Mace Head station is only one in the network of Global Atmosphere Watch, which compares atmospheric data world wide: mixing ratios of carbon dioxide, carbon monoxide, methane, sulphur dioxide, dinitrogen oxide and others.
|
4. A traditional mass spectrometerMass spectrometry is a method of analysing molecules of different molecular masses. The molecules are positively charged by electron bombardement, which takes away one electron. The charged molecules (ions) go through a bent electric field and depending on their mass their path is either bent just in the right manner in order to reach a dectector or they end up on the walls of the field block. Different masses can be separated and detected by changing the strength of the field.
|
|
|
Basically, carbon dioxide is homogeneously spreading world-wide and the mixing ratios at two different places vary only by a few parts per million (ppm). Very accurate data however depend also on the local sources and sinks of CO2. For example large towns and coal power plants emit a lot of CO2. The Mace Head station is close to the ocean. Here phytoplankton (algae) take up carbon dioxide and partially transport it to the deeper ocean layers when dying. In the growing season also the big forests are sinks of carbon dioxide and convert it into biomass. |

|
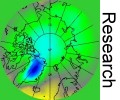
Taking into account all these factors, we will find a seasonal variation of CO2 but also some peaks from temporary disturbance as you can see in the high resolution diagram from Barrow on the left. Gerard Spain is research assistant in Mace Head and answers our question: How can we make sure that only clean air, hardly influenced by human emissions (so called 'background' air), is measured in the weekly or monthly glass flasks?
|
|
|
"The flask samples are normally only collected under clean, background conditions. When non-background air is sampled, it is either done so as to collect a sample representative of continental air (coming for example from the industrial regions in Europe) or simply to avoid a large gap in the data record. In either case it is noted as such and is not included in any "background" analysis. |
|
|
|
|
What do scientists have to think about when measuring CO2 mixing ratios? Some rules of good analysis are also important for many of your classroom results.
|
Sampling:
|
|
|
Contamination:
|
|
Reference: Instrument:
|

|
Scientists often spend a lot of their research time trying to improve the techniques and to avoid the potential mistakes described above. Nowadays, excellent instruments are available but mistakes can easily be made in sampling, owing to contamination or reference problems. Author: Elmar UherekMax Planck Institute for Chemistry, Mainz, Germany |