> ACCENT en > Nr 3 Sept. 2005 methane/energy > C: Energy today and tomorrow
|
|
 |
Context: Energy today and tomorrow
|
Key words:
energy supply, fossil fuels and renewables, emission, emission trading, sustainability | |
Energy today and tomorrow:
- What is the situation now?
- Where are we going?
|
 |
 |
|
1. Oil refinery - when will lights turn off for oil as the leading energy source? © freefoto.com
|
 What is the situation now? What is the situation now?
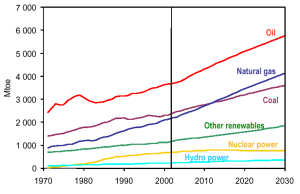
The world-wide economy is driven by huge amounts of energy. Most of it comes from fossil fuels (oil, natural gas and coal). Experts from the International Energy Agency (IEA) assume that in the coming decades fossil fuels will account for 85% of the energy need. However, we have two big problems:
1) Resources are getting shorter and the price is raising
2) Greenhouse gases from fossil fuels change the world's climate system
|
 |
 |
 |
|
2. Expected growth of the world's energy consumption by energy source.
Click the image for high resolution! (15 K)
© IEA, CSIS
|
|
|
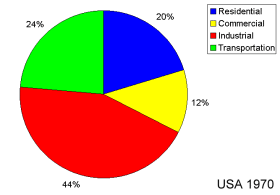
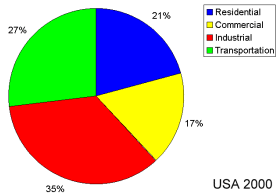
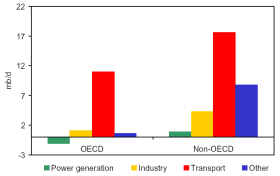
The need for energy goes up because the world's population grows and even though many technical processes have become more efficient the needs per person have also greatly increased. A major reason is increasing mobility. There are more car owners, cars have become bigger and more powerful and more people go by plane. It's not just people but also goods that are transported over longer distances.
|
|
|
 |
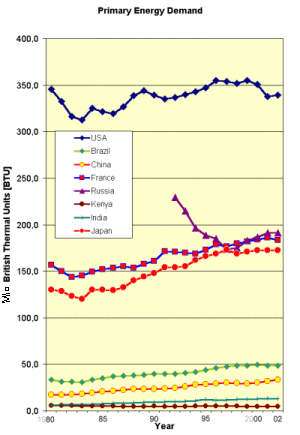
The amount of energy we use depends heavily on our living conditions and varies enormously over the world. The primary energy consumption per person and year is given in Million BTU (British Thermal Units) on the graph on the left.
1 BTU = 252 cal = 1055 J
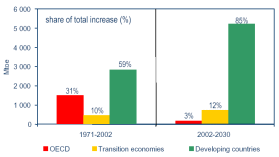
Energy experts are worrying about the increasing energy demand in the developing countries of Asia, and in particular China. However, the demand per capita there is still much lower than in Western Europe or North America.
4. Primary energy demand per capita
Data source: IEA, Graph: Elmar Uherek
Please click the image for a larger view! or for extra large HERE!
|
 |
 |
|
5. Import - Export - Transport ... More and more people and goods become more and more mobile.
© original fotos: freefoto.com
|
 Where are we going? Where are we going?
We cannot clearly foresee where we are going exactly in the next decades. But if the present world-wide policy and consumer behaviour does not change drastically, it can be expected that in 2030 even more energy from fossil fuels will be used than now (see fig. 2).
This is not only a burden for our climate system and living conditions owing to the further increase in greenhouse gases and global warming. The world's economy will also strongly depend on oil and gas rich regions, which are politically unstable at the moment.
|
 |
 |
 |
|
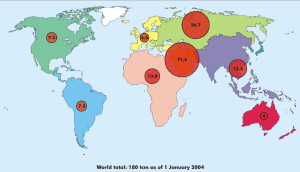
6. Natural gas resources of the world in trillion cubic meters (tcm). © IEA / CSIS
Please click the image for a larger version!
|
|
|
Further reading: The International Energy Agency IEA publishes the World Energy Outlook WEO. A brief overview of key contents of the WOE 2004 can be downloaded from the website of the Center for International and Strategic Studies in Washington:
http://www.csis.org/energy/041109_WEO-2004.pdf
Many figures of this article are taken from this source.
Energy demand data are taken from the IEA website:
|
 > ACCENT en > Nr 3 Sept. 2005 methane/energy > C: Energy today and tomorrow


