 > ACCENT en > UQ 2 Mar 07 Urban air > R: Pathways of air
|
Trajectories - tracks of the airThe journey of gases and particulate matter through the air is a bit more direct than that of money. It is primarily the wind that decides the path the air takes. To some extent the surface structure of the Earth can also be decisive. Valleys and mountains can form barriers. Sea and land warm up with different speeds and next to the coast different rules apply to the wind. |

From wind measurements at weather stations, from satellite observation and from computer models we can calculate the basic wind directions which dominate over Europe. We can conclude where the air we have here today has been two or three days before. If the air contains certain gases or particles we can estimate their place of origin. Such pathways or tracks of the air are described in trajectories. Trajectories are fictitious or calculated ways of air masses. |
|
|
Please click on the link on the left in order to sea a video stream. © terra3D |
|
Trajectories are fictitious or calculated paths an air parcel is moving along. You can imagine an air parcel as a group of gas molecules and particles whose wind-driven way we observe. |
|
Claus shows a map to Katja: Have a look. This map shows Great Britain. On the left hand side the red areas mark regions where high ozone values have been measured. For the formation of ozone a warm bright day is required. But additionally there need to be some chemicals in the air: organic compounds from industrial emissions or from the forests and nitrogen oxides from traffic emissions. The trajectories tell us where these gases potentially came from. |
|
Katja studies the map for a few moments and understands. The air came from continental Europe. In the north where it has a longer way over the sea, less ozone is found. |
Katja thinks about the trajectories. This is complicated! So the chemicals in our air are a mixture. Some compounds are produced near where we live, like the coffee flavour. Others have travelled a long way. So we cannot do much about the dirty air in our city because it comes from other countries, can we? Yes and no! The air which has come a relatively long way is usually less polluted. I will try to make a sketch to show how we can imagine the conditions in our town. |
|
|
"Look, I am drawing a landscape: a town, two villages, the trees are representing unpopulated land." |
 |
|
5. Sketch of a landscape; collage: Elmar Uherek |
|
I add on the right and on the left a scale for air pollution. There is some pollution also over unpopulated land and little villages. It comes from far away and spreads everywhere. Maybe even from America or Asia, definitely from other European countries. We call it 'background concentration', since this air is present everywhere in the background. This pollution level is indicated in a light orange. |
 |
|
6. Landscape with background pollution. Collage: Elmar Uherek |
|
Katja interrupts. Is the air from far away always pollutedlike that? |
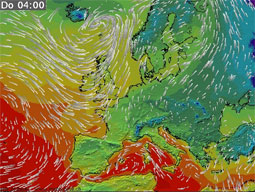
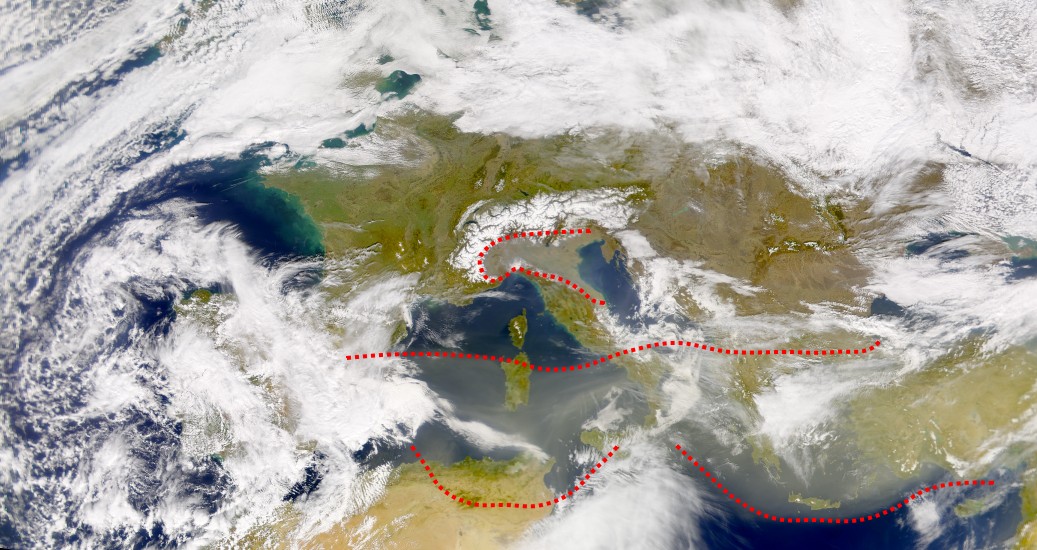
Claus hesitates. Well, this image is rather simple. It depends a bit on the wind. Have a look at the satellite image and the little movie. Here, the air came from the Sahara and brought a lot of sand. Mum always complains when the windows are so yellow from the sand. But this does not happen every day. |
|
 |
|
8. The satellite image shows in the red dashed area a big cloud of desert dust moving towards Europe. In Northern Italy, however, emissions from the industrialised Po valley pollute the air. |
|
Let's come back to the image. Around the town a hill of pollution is indicated. In towns with a lot of traffic, industry, many houses and people, there is also a lot of air pollution. It ususally spreads from the centre of the town towards the suburbs. |
 |
|
|
|
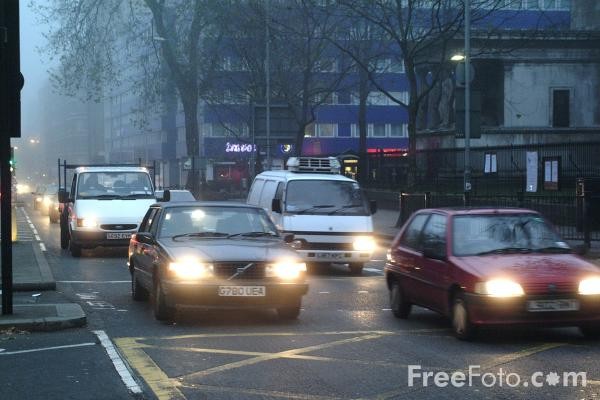
But this sketch does not describe the details very well. If you live in town, you may live in quiet housing area as you do here. Sometimes there is coffee in the air but usually there are not many cars. But your friend Conny, for example, is living on a main road. They have car traffic the whole day long. Nitrogen oxides, soot and other particles come from exhaust pipes and tyres. They worsen the air quality in such streets. There, we find local peak values of particles and other pollution in a town. I've also drawn these high values as peaks in the picture. |
|
Well yes. That's not nice for Conny. It's not very healthy to live in a busy street. But Conny is living in the third floor. And her bedroom is towards the North, because it is cooler in summer. Does the pollution also come from the North trough the window? You said, most of the time we have westerly winds. |
|
|