|
|
 |
|
Pollution from human activities can lead to the formation of ozone smogs. These smogs are dangerous to our health. We know a lot about how ozone forms in the lower atmosphere so we can take measures to minimise the risk of ozone smogs.
The graph shows the relative amounts of three air pollutants on a summer day.
|
Why are high levels of hydrocarbons and nitrogen oxides seen in the morning?
Does the graph show any evidence of ozone formation being linked to hydrocarbon and nitrogen oxide chemistry?
|
 |
|
|
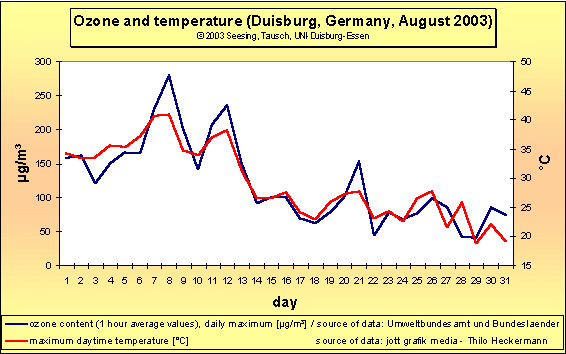
This graph shows the maximum daily temperature and the maximum daily atmospheric ozone concentration in August 2003 in Duisburg, Germany.
|
 |
 |
|
link addresses of sources:
Umweltbundesamt und Bundesländer: http://www.env-it.de/luftdaten/start.fwd
jott grafik media - Thilo Heckermann: http://www.wetter-duisburg.de
|
|
Compare the two graphs. What do you see?
|
|
About this page:
authors: M. Seesing, M. Tausch - Universitšt Duisburg-Essen, Duisburg, Germany
scientific reviewer: Dr. Rolf von Kuhlmann, Max Planck Inst. for Chemistry, Mainz
last update: 2004-05-13
|
|
 |
|


