 > English > Climate Encyclopaedia > Climate in Cities > basics > 1. Air Pollution > - Negative effects
|
|

Negative effects of air pollutionAir pollution has an impact on both local and global scales. Harmful substances which are emitted into the atmosphere in one country, are transported by the wind and cross over national borders. International co-operation is, therefore, necessary to improve overall air quality.
|
|
Global negative effects of air pollution include the enhanced greenhouse effect and the ozone hole. Smog and acid rain are the best known local effects and smog, in particular, affects people living in urban areas. Air pollution is a threat to our health and can also cause economic losses.
|
|
Let's concentrate on air pollution in cities. Sulphur and nitrogen oxides, hydrocarbons (mainly from refineries and traffic), carbon monoxide, heavy metals (from traffic and industry), dust and soot are all found in urban air. The proportions of these pollutants vary depending on the location. For example, use of low sulphur containing fuels has dramatically decreased the atmospheric concentrations of sulphur dioxide in developed countries.
|

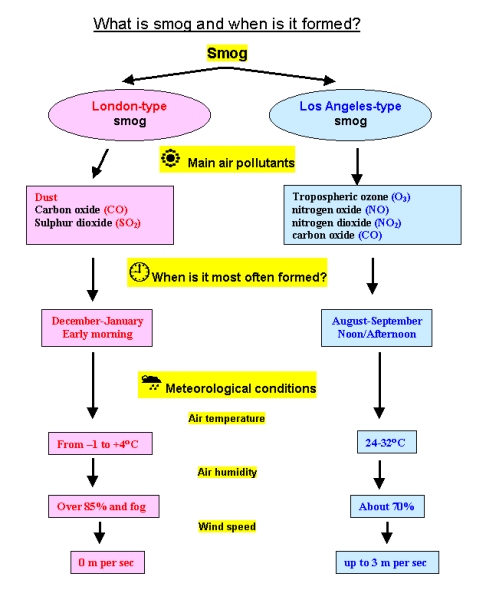
SmogIn many cities, air pollution levels exceed the allowed concentrations and smog alarms are published. The word "smog" is the combination of the words smoke and fog, it was invented around 1911 by the physician Harold Des Voeux. There are two kinds of smog:
|
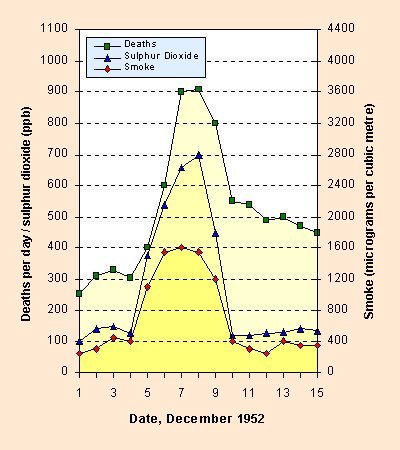
- London-type smog. Burning coal leads to emissions of sulphur dioxide and dust. When these pollutants mix with fog, droplets of highly corrosive sulphuric acid (H2SO4) are produced in the air. In London in 1952, concentrations of SO2 during a smog event exceeded 3.5 mg m-3 (3500 µg m-3) and many people died. London type smogs were first recorded in the 1850's and are rather rare today due to better controls on air pollution. For example, in 2001, mean annual concentrations of SO2 reached 3 µg m-3 in Barcelona (Spain), 4 µg m-3 in Munich (Germany), 7 µg m-3 in London (Great Britain - data for 1999) and 13 µg m-3 in Warsaw (Poland). On some days, however, concentrations of SO2 can be much higher. The highest hourly values for SO2 in 2001 were 211 µg m-3 in Warsaw, 106 µg m-3 in London (1999), 70 µg m-3 in Barcelona and 17 µg m-3 in Munich.
|
|
- Los Angeles-type or photochemical smog. This type of smog forms on sunny days and is the result of emissions from traffic. Nitrogen oxides from car exhausts and hydrocarbons from various anthropogenic and biogenic sources react in the presence of sunlight to produce a noxious mixture of aerosols and gases. Photochemical smog contains tropospheric ozone, formaldehyde, ketones and PAN (peroxyacetyl nitrates). Normal tropospheric ozone levels are less than 0.04 ppm but ozone levels can be as high as 12 ppm in these smogs. The substances in these smogs are irritating to our eyes and can damage our respiratory system. They also affect vegetation. This type of smog is rather common now in large cities in the summer and has generally replaced the London-type smog. For more information on concentrations and mixing ratios see the topic on the Higher atmosphere.
|
|
|
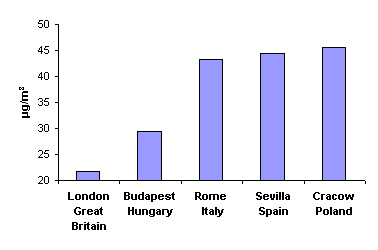
Dust and sootAnother problem in cities is dust and soot. In 1999, for example, the mean annual concentration of particulate matter less than 10 micrometers in diameter (PM10) was 21.8 µg m-3 in London, 29.5 in Budapest, 43.3 in Rome, 44.4 in Sevilla and 45.4 in Cracow. These values have decreased with time due to better pollution control measures. For example, annual mean particulate concentrations in Cracow in the 1970's and 1980's exceeded 100 µg m-3 due to emissions from the steel factory and the power plant and reached levels of 200 µg m-3 in the winter. These factories have since been modernised and production has decreased leading to significant improvements in air quality.
|
Limit valuesFor every pollutant there are established limit values of concentration which should not be exceeded. These limits are designed to prevent damage to human health and to the environment. For the European Union countries, the limit values and alert thresholds for ambient air were established with the Council Directive 96/62/EC, 27 September, 1996. Detailed regulations were included in three Council Directives: 1. 1999/30/EC, 22 April, 1999; 2. 2000/69/EC, 16 November, 2000, and 3. 2002/3/EC, 12 February, 2002.
|
|

|
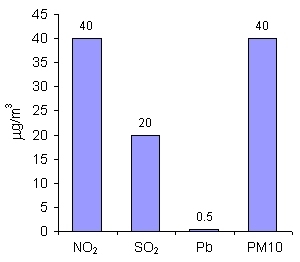
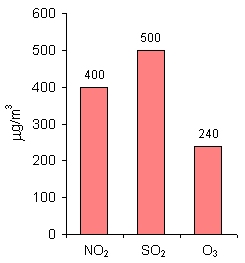
For nitrogen dioxide (NO2), sulphur dioxide (SO2), lead (Pb) and particulate matter up to 10 µm in diameter (PM10), the limit values are given as mean annual concentrations. This means that on any particular day, the concentrations may be higher than the limit value, while on other days it may be much lower, but on average over the whole year, the limit value should not be exceeded. The limit values for SO2 and Pb are much lower than those for NO2 and PM10, as these substances are more harmful to human health.
|
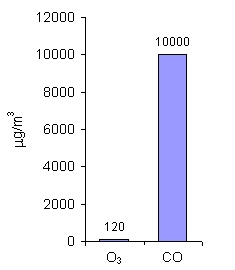
For ozone (O3) and carbon monoxide (CO), the limit values are given as 8-hour mean concentrations. These gases are very toxic to people even in very small amounts and over short exposure periods. As you can see, allowed amounts of ozone in the air are much lower than for CO. Low level ozone is formed during photochemical smog episodes and is harmful to us, whereas ozone in the stratosphere protects life on Earth.
|
|
|
Alarm valuesFor NO2, SO2 and O3, as well as the limit values, alarm values have also been established. These are 1-hour mean concentrations. If these values are exceeded, the local authorities should first inform the public and then undertake actions that decrease the pollutants' concentration in the air. For example, they may have to limit the traffic in a city or decrease industrial production until levels of the pollutant have declined sufficiently.
|
|
Related pages: You find further information about enhanced greenhouse effect or ozone hole in: |
|
About this page:Authors: Pawel Jezioro, Anita Bokwa - Jagiellonian University - Cracow / Poland |