|
|
 |
|
|
|
|
| |
|
|
|
Climate in cities
Basics |
Causes of anthropogenic air pollution
Most of the air pollution which comes from human activity enters the atmosphere from industry, vehicles and the combustion of fossil fuels in power plants. In developed countries vehicles are the main source of air pollutants in the cities. |
|
|
|
|
|
Sources of anthropogenic air pollution
Combustion of fossil fuels during power production, in heating systems and in vehicle engines is the main source of anthropogenic air pollution. Other sources include industry and agriculture.
|
 |
|
|
1. Fire-places were one of the first anthropogenic sources of air pollution. Source: www.freefoto.com
|
|
|
At the beginning of human civilisation the only source of anthropogenic air pollution was smoke from fire-places. As the population grew, air pollution problems also increased. By 1273, King Edward the First of England had banned the use of coal in London as it caused enormous air pollution problems.
|
In the 20th Century, industrial development led to high numbers of factories in urban areas. This was accompanied by a significant increase in the urban population and, as a result, the number of buildings and cars grew. High density housing and narrow roads made vehicle traffic a particularly important source of pollutants. This is still a huge problem and in cities of the developed world, vehicles are now the most important source of air pollution.
|
|
 |
|
|
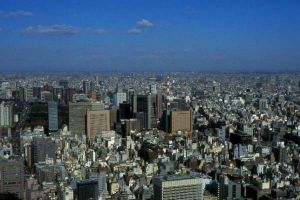
2. Intensively urbanised area. High concentrations of residential buildings, service industries and factories in urban and industrialised areas are one of the reasons for air pollution. Source: www.freefoto.com
|
|
 |
|
|
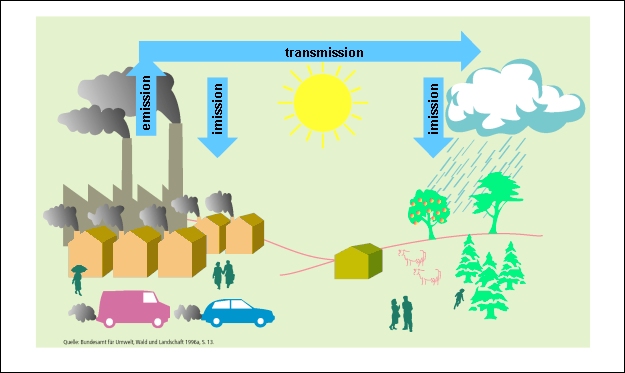
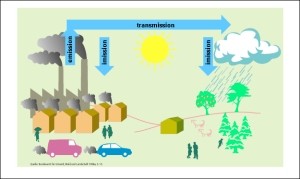
3. Emission and deposition (denoted imission on the figure). Source: Bundesamt für Umwelt, Wald und Landschaft 1996. Please click to enlarge! (76 K)
|
|
|
Emission and deposition
Air pollutants are emitted from urban areas and also from rural locations. The harmful gases and aerosols are transported by the wind great distances away from their initial source before they are deposited back to the ground. So when we measure the concentration of a pollutant to determine the air quality, we must remember that the pollutant may have come from some distance away and doesn't necessarily have a local source.
|
Units
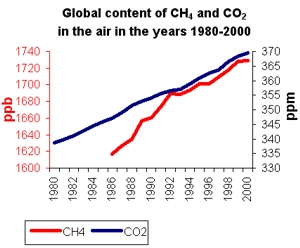
While emission and deposition values are usually given in large amounts (e.g. tonnes per year), atmospheric concentrations are generally expressed in much smaller units (e.g. in fractions of grams or moles of a substance per cubic metre of air). When we look at atmospheric concentrations we can either talk about average concentrations for the whole Earth (in case of carbon dioxide CO2), or for a given place and time (e.g. sulphur dioxide SO2 levels in London, in December 1952). Concentrations of gases are often given as a mixing ratio, this is the fraction of the compound as a proportion of all the air molecules present. It is usually expressed in ppm (parts per million) or ppb (parts per billion). You can find out more about the mixing ratio in the Higher atmosphere topic.
|
|
 |
|
|
4. Changes in global content (mixing ratio) of carbon dioxide (CO2, in ppm) and methane (CH4, in ppb) in the atmosphere. Author: Anita Bokwa. Source of data: World Resources Institute (http://earthtrends.wri.org).
|
|
Anthropogenic emissions
As we saw in the section "What is air pollution?", some emissions have a global impact on climate while others have only a local effect. Areas with high levels of anthropogenic air pollution include Eastern USA and Canada, Europe and South and South East Asia. Emissions of sulphur dioxide (SO2) and nitrogen oxides (NOx) from these areas contribute to acid rain and this effect is discussed later in this topic. Large quantities of carbon dioxide (CO2) and Volatile Organic Compounds (VOC's) are also emitted into the air. Some of the VOC's (e.g. methane CH4 and the chlorofluorocarbons) can act as greenhouse gases and we look at these in more detail in the section looking at the impact of industry on air pollution.
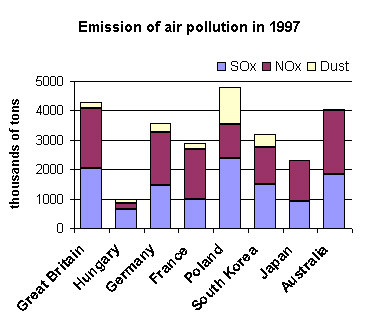
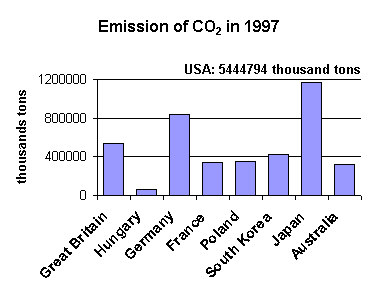
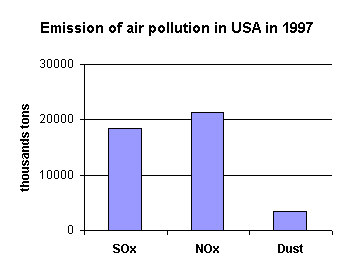
The table below and the charts in figure 5 show air pollutant emissions in selected countries. The emissions vary greatly and we look at the reasons for these differences below using CO2 as an example.
|
|
Country |
SOx |
NOx |
CO2 |
Dust |
|
Great Britain |
2 028 |
2 060 |
539 344 |
213 |
|
Hungary |
657 |
197 |
58 498 |
136 |
|
Germany |
1 468 |
1 803 |
834 379 |
316 |
|
France |
989 |
1 691 |
344 666 |
211 |
|
Poland |
2 368 |
1 154 |
348 260 |
1 282 |
|
South Korea |
1 500 |
1 258 |
424 119 |
423 |
|
Japan |
903 |
1 409 |
1 164 518 |
- |
|
USA |
18 481 |
21 394 |
5 444 794 |
3 393 |
|
Australia |
1 842 |
2 166 |
316 704 |
38 |
Yearly emissions of sulphur dioxide, nitrogen oxides, carbon dioxide and dust for selected countries (in thousands of tonnes per year).
Click on the icons below to see the data from the table above in the charts! |
5. a) Emissions of air 5. b) Emissions of CO2 5. c) Emissions USA air
pollutants in 1997 in 1997 pollutants in 1997 |
5. Air pollution emissions in chosen countries. Please click icon to see enlarged chart! (15-30 K). Authors: Anita Bokwa, Pawel Jezioro.
Source of data: Carbon Dioxide Information Analysis Center, United Nations Framework Convention on Climate Change http://webdab.emep.int
|
Example:
Emissions which have global impact: Carbon dioxide (CO2)
Emissions of CO2 have a global impact on our climate. Let's see who emits the largest amounts of CO2 in the world. According to the Energy Information Administration, the global emission of CO2 in 2001 amounted to 6567.82 million tonnes of carbon equivalent units.
What are carbon and carbon dioxide equivalent units?
Carbon equivalent units are defined as the carbon dioxide equivalent multiplied by the carbon content of carbon dioxide (i.e., 12/44). The carbon dioxide equivalent is used to compare greenhouse gases and is derived by multiplying the mass of the gas by its global warming potential. The global warming potential measures how strong a greenhouse gas is. For example, methane has a global warming potential of 21, so its 21 times more powerful a greenhouse gas than CO2.
|
 |
|
|
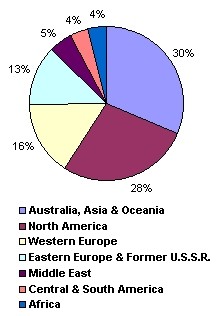
6. Emissions of CO2 in 2001 by continents. Authors: Anita Bokwa, Pawel Jezioro. Source of data: www.eia.doe.gov/emeu/iea/
|
|
|
Emissions by continents
About a third of the world's CO2 emissions come from Asia, Australia and Oceania and 28% comes from North America. So almost 60% of the global CO2 emissions come from these two regions. However, even though both regions emit almost the same amount of CO2 per year, the causes are quite different. About 3.9 billion people live in Asia, Australia and Oceania, that's 61% of the world population, whereas only about 323 million people live in North America (U.S.A. and Canada).
High CO2 emissions in Asia, Australia and Oceania are simply the result of the huge number of people living in the region, in North America it is the very high consumption of energy which is the cause.
|
 |
|
|
7. Countries which had the largest share (in %) of the world total emission of CO2 in 1999.
Click on the image to see it enlarged (52K)!
Author: Elmar Uherek. Source of data: UN Human Development Report 2003
http://hdr.undp.org/reports/global/2003/pdf/hdr03_HDI.pdf
|
|
|
Emission by countries
Figure 7 shows the countries which emit the largest amounts of CO2 in the world. For example, 23.2% of global CO2 emissions come from the USA. USA, China and Russia together make up over 42% of the global CO2 emissions although only 27% of the world's population lives in these countries. Among the seven largest emitters, one is in North America, three are in Europe and three are in Asia (note that although Russia is in both Europe and Asia, it is usually included with the European countries). There are no large CO2 emitters in the Southern Hemisphere.
|
Emission per capita
Figure 8 shows how much CO2 is emitted per person in certain countries. For example, 19.7 tonnes of CO2 are emitted per citizen in the USA, while in India it is only 1.1 tonnes. Such huge differences result from the different degree of economic development. The higher the standard of living in a country, the higher the energy consumption (through the use of cars, air conditioning and electrical appliances) and therefore the greater the CO2 emissions.
|
|
 |
|
|
8. Emissions of CO2 per capita in chosen countries.
Click on the image to see it enlarged (22 KB)!
Author: Elmar Uherek. Source of data: UN Human Development Report 2003
http://hdr.undp.org/reports/global/2003/pdf/hdr03_HDI.pdf
|
|
Anthropogenic emissions by sectors
Anthropogenic air pollution comes from many sources. One source can often emit many different pollutants but some human activities, for example transport, produce very characteristic chemical species. The data from UNECE/EMEP (United Nations Economic Commission for Europe/Co-operative programme for monitoring and evaluation of long range transmission of air pollutants in Europe) shows which sectors of the economy (what kind of human activity) were mainly responsible for emissions of carbon monoxide (CO), nitrogen oxides (NOx) and sulphur oxides (SO2) in Europe in 2001. The emissions are given in gigagrams (Gg) where 1 Gg = 1000 tonnes.
|
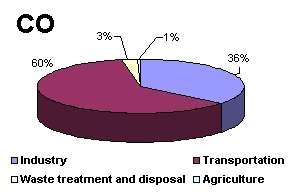
Carbon monoxide (CO)
30,679 Gg of CO were emitted in Europe in 2001. The main source of this anthropogenic CO was transport (60%) with industry contributing 36%. Waste management and agriculture were of marginal importance. You can find out more about CO emissions in the topic on the Lower Atmosphere.
|
|
 |
|
|
9. Emission of CO in Europe in 2001 by sectors.
Authors: Anita Bokwa, Pawel Jezioro
Source of data: http://webdab.emep.int
|
|
 |
|
|
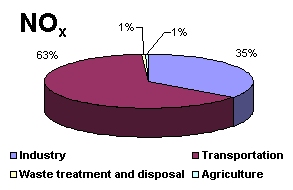
10. Emission of NOx in Europe in 2001 by sectors.
Authors: Anita Bokwa, Pawel Jezioro
Source of data: http://webdab.emep.int
|
|
|
Nitrogen oxides (NOx)
10,056 Gg of NOx were emitted into the atmosphere in 2001. Transport was the biggest source, making up 63% of the emissions. Industry contributed 35% and emissions from waste management and agriculture were, again, of marginal importance.
|
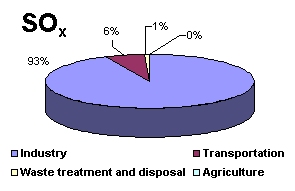
Oxidised sulphur compounds (SOx)
The main component of the oxidised sulphur compounds is sulphur dioxide (SO2) and, unlike CO and NOx, their main source is industry. Total emissions of oxidised sulphur were 5,949 Gg in 2001 and 93% of these came from industry. Find out more about the impacts of SO2 and NOx in the section on acid rain.
|
|
 |
|
|
11. Emission of SOx in Europe in 2001 by sectors.
Authors: Anita Bokwa, Pawel Jezioro
Source of data: http://webdab.emep.int
|
|
 |
|
|
12. Urban traffic
Urban traffic is the main source of air pollution in many cities.
Source: www.freefoto.com
|
|
|
Emissions in cities
The main emission sources and the main air pollutants vary between cities as they depend on the poulation size, the types of industry located there, how much traffic there is and what kinds of heating systems are used. Pollutants are emitted into the city air from low emission sources (e.g. individual heating systems in houses), high emission sources (e.g. tall factory chimneys) and from mobile sources (e.g. cars and buses). For example, Cracow is a medium-sized city in southern Poland with 800,000 inhabitants. It has heavy industry (a steel works and a huge power plant) and large amounts of traffic. Industry emits almost all of the SO2 into the air, most of the NOx and dust and as much CO as transport. Other sources of air pollution are of marginal importance. However, in many Western European cities, transport is the main source of CO and NOx, because heavy industry has declined and ben replaced with clean new technologies.
|
|
sector/pollutant |
CO |
NOx |
dust |
| transportation |
48% |
15% |
2% |
| industry |
44% |
83% |
88% |
| municipal economy |
8% |
2% |
10% |
| sum |
100% |
100% |
100% |
Emission of carbon monoxide (CO), nitrogen oxides (NOx) and dust by sectors in Cracow, Poland, in 2001. Source: Inspectorate of Environmental Protection in Cracow.
|
|
About this page:
Authors: Pawel Jezioro, Anita Bokwa - Jagiellonian University - Cracow / Poland
Supporter: Grzegorz Wawrejko
1. Scientific reviewer: Prof. Barbara Obrebska-Starkel - Jagiellonian University - Cracow / Poland - 2003-06-20
2. Scientific reviewer: Dr. Marek Nowosad - Maria Curie-Sklodowska University - Lublin / Poland - 2003-06-16
3. Scientific reviewer: Prof. Wilhelm Kuttler - University of Essen / Germany - 2003-09-12
4. Scientific reviewer: Dr. Ulrich Reuter - Stuttgart / Germany - 2003-09-03
educational reviewing: Michael Seesing - University of Duisburg - Duisburg / Germany
last update: 2004-05-25
|
|
|
|