|
|
 |
|
|
|
|
| |
|
|
|
Lower Atmosphere
Basics |
Different landscapes - the horizontal extension
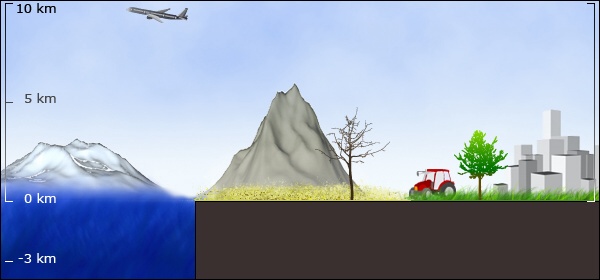
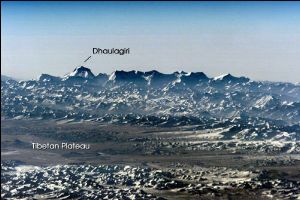
The troposphere is much more than just a shell around a sphere. The surface of the Earth is rough and structured. The depth of the ocean is between two and six kilometers, in some places even deeper. The highest mountains are greater than six kilometers in height. That's about half the altitude of the troposphere!
|
|
|
|
|
|
1. The troposphere - a very structured place. Author: Anja Kaiser © ESPERE
|
Different landscapes
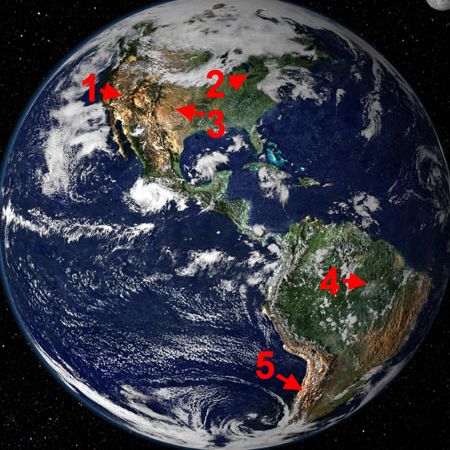
Have a look at the Earth and the two American continents below and explore our planet a bit:
Look up the numbered places in an atlas!
What is the landscape like?
Is the climate dry or wet?
What latitudes are dry, where is it wet?
Which climate zones do the places belong?
What temperatures would you expect in the winter and the summer?
How much rain falls?
The troposphere is in contact with many different landscapes and climate zones: dry deserts, snowy mountain peaks, humid rain forests and don't forget the oceans, these make up 71% of the contact area.
|
|
 |
|
|
2. Mountains reaching high into the troposphere. The photograph shows a view across the Tibetan Plateau. The Dhaulagiri Peak (8167 m) is higher than the troposphere at the poles. Source: NASA Earth Sciences and Image Analysis.
http://visibleearth.nasa.gov/cgi-bin/viewrecord?783
|
|
 |
|
|
|
3. Our planet Earth from space. Author: Reto Stockli, Nazmi El Saleous, and Marit Jentoft-Nilsen, NASA GSFC. To see the detailed structure of the landscape, please click the thumbnails below (about 75 K per picture).
|
|
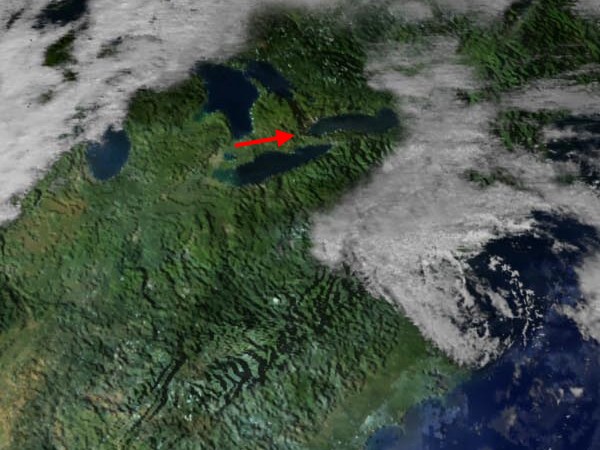
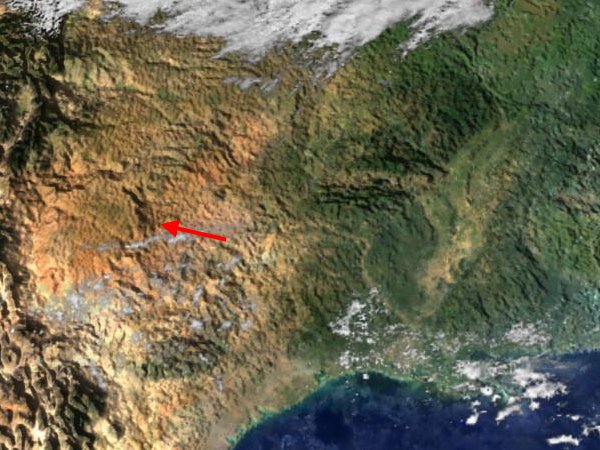
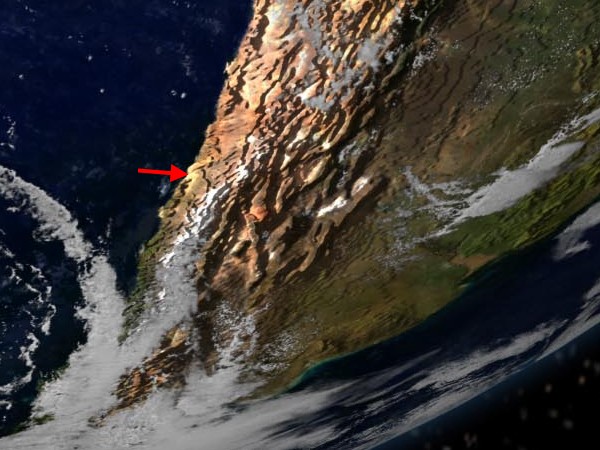
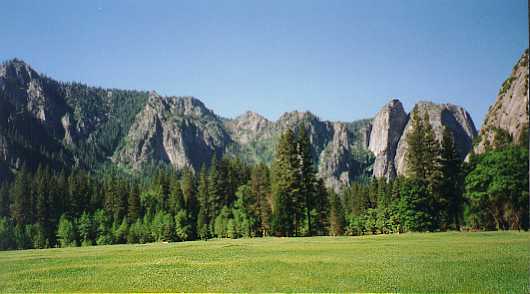
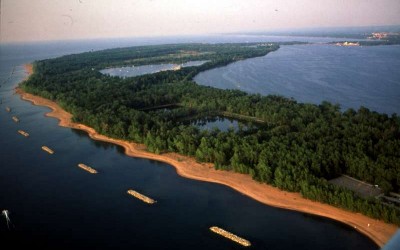
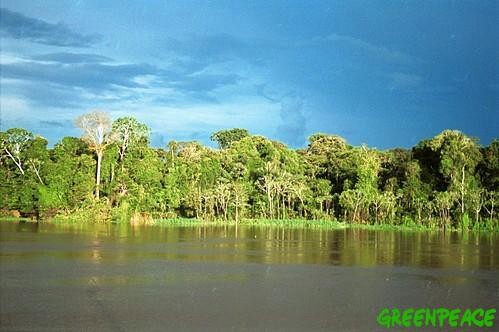
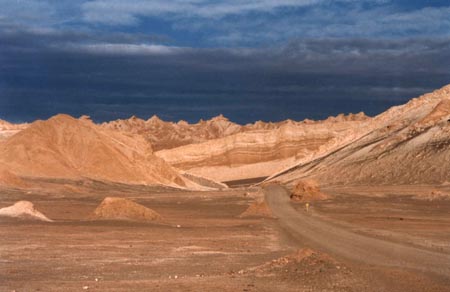
Below are three pieces of information about the places marked on the globe above: 1) A modified image from space (75 KB per image); 2) a photograph of the landscape (50 KB); 3) annual average temperatures and precipitation from this place or a place nearby (10 KB).
|
4. Locations: 1) Yosemite Park, Rocky Mountains (USA) - 2) Erie Lake Area, Pennsylvania (USA) - 3) Landscape near El Paso, Mexican boarder (USA) - 4) Amazonian rainforest (Brazil) - 5) Atacama desert (Chile).
|
Click on the climate icon to see the average temperature and precipitation for the different places shown above! Please note: Summer is always in the middle of the graph, i.e. the month time scale is not the same for the northern and southern hemispheres. Source:  www.klimadiagramme.de - Bernhard Mühr. www.klimadiagramme.de - Bernhard Mühr.
|
 |
|
|
5. Koeppen's climate map - This shows which climate zone the places above belong to.
|
The human population on Earth
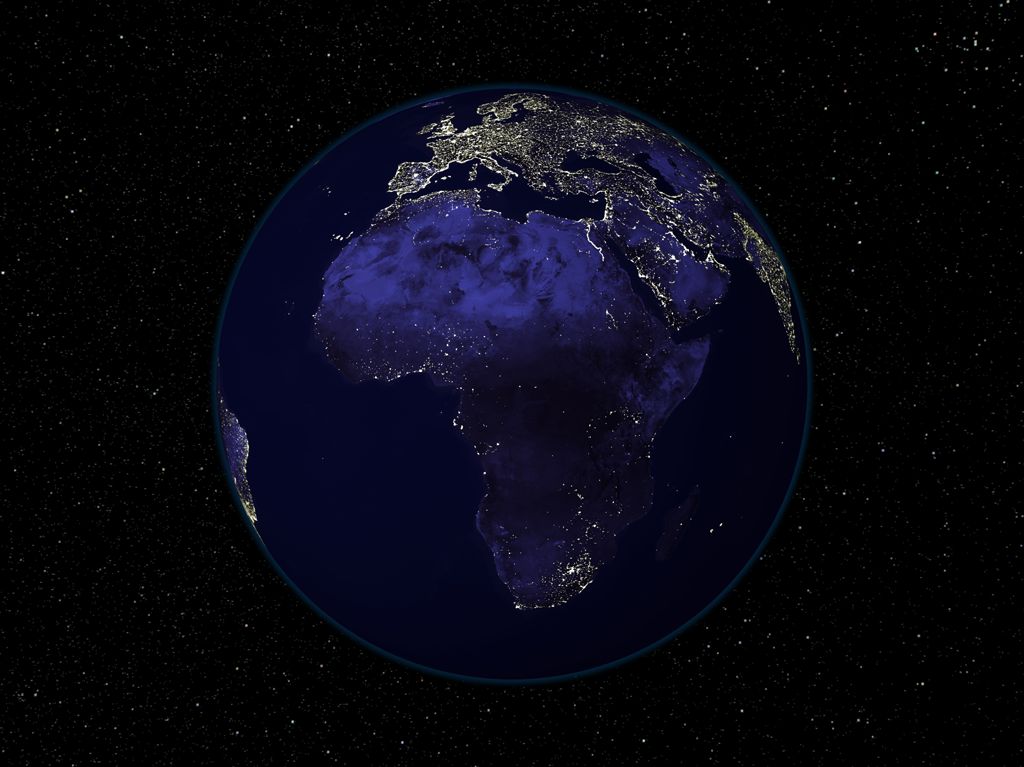
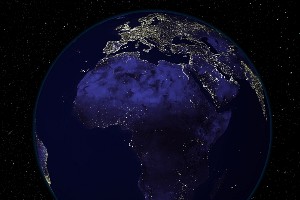
The examples above show different natural landscapes from space and from photographs. These images and the climate diagrams give us an impression of their climate. The composition of the troposphere is not, however, just governed by natural processes. Humans also affect the troposphere through energy release and emissions of chemicals. The view of city lights at night over the globe shows that human activities, other than agriculture, are concentrated in particular regions of our planet, the big urban areas.
Data: AVHRR, NDVI, Seawifs, MODIS, NCEP, DMSP and Sky2000 star catalogue.
|
|
 |
|
|
6. The world at night. Authors: AVHRR and Seawifs texture: Reto Stockli; Visualization: Marit Jentoft-Nilsen, VAL, NASA GSFC. Please click to enlarge! (95 K)
|
|
 |
|
|
7. Imagine the total size of land (in brown) and water (in blue) on Earth compared to the size of Poland. Please click to enlarge! ( 5 K )
|
|
|
How large is the area covered by the troposphere?
People sometimes think that if it is unsually cold or warm or that there is too much rain or too little snow in our country for a few days or weeks then this is a sign that the climate is changing. But what does it really mean if such unusual events take place in our country? How big is, for example, Poland compared to the area of our planet?
Let's have a look:
Area of the Earth's surface: 510,000,000 km2 (29.2% land, 70.8% water)
Surface area of Poland: 312,000 km2
The Earth's surface is 1637 times bigger.
Here you can see this relationship (land is shown in brown, water in blue and Poland in red).
|
|
For global climate change to be real, changes should be seen over a period of at least 30 years (1560 weeks). If you observe unusual weather for one week in Poland, you only see it on 1/1637 of the Earth's surface and for just 1/1560 of the time recommended.
How do you think we can observe climate change in an objective way? Ask your parents and grandparents about the climate when they were young. Is it different from nowadays? Think about how your perception of average weather conditions are influenced by the environment, by where you live and your personal feelings.
|
About this page:
author: Dr. Elmar Uherek - Max Planck Institute for Chemistry - Mainz / Germany
1. sci. reviewing: Dr. Katja Mannschreck - GAW Hohenpeissenberg - Germany - 2003-08-07
2. sci. reviewing: Dr. Gerd Folberth - Meteorological Service of Canada / Univ. of Victoria - 2003-08-10
edu reviewing: Michael Seesing - Uni Duisburg - 2003-07-02, Dr. Yvonne Schleicher - Univ. of Erlangen-Nuernberg - Germany
last published and revised: 2008-10-09
|
|
|
|