1. Have a look at the diagram
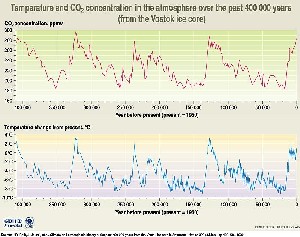
This figure shows profiles of CO2 concentrations and temperature over the last 400,000 years.
Describe the patterns you can see. How do the two profiles vary? What has happened to the CO2 concentrations in recent time?
|
 |
 |
 |
|
1. Temperatures and CO2 concentrations over the last 400,000 years. Data reconstructed from measurements made in ice cores from the Vostok station in Antarctica. Source: UNEP/GRID-Arendal, Norway (click to enlarge, 101 kB)
|
|


