|
|
 |
|
|
|
 |
| |
|
|
 |
Upper Atmosphere
Read more |
Dynamics of the Stratosphere
Processes in the stratosphere take place very slowly compared to those in the troposphere. The stratosphere is extremely stable and there is only little air exchange with the troposphere. This small air exchange is, however, extremely important to our climate.
|
|
|
|
|
 |
 |
 |
|
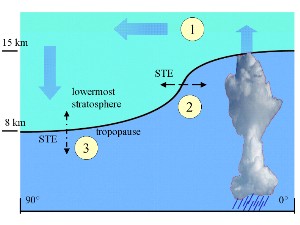
1. The direction of global circulation and stratosphere troposphere exchange (STE).
by Elmar Uherek.
Please click to enlarge!
|
|
 |
Stratosphere-Troposphere Exchange (STE)
Transport of air around the globe is driven by the Sun. Radiation from the Sun warms up the land, sea surface and air. Heating is greatest in the tropics, less so in the mid and high latitudes. This means that convection is strongest in the tropics and air rises to higher altitudes here compared to elsewhere on Earth. Above the tropopause, absorption of solar radiation by ozone leads to a warming of the stratosphere. This warming is highest over the tropics, lower in the polar regions and goes to zero in the polar winter. Figure 1. shows the consequences of this, warm air rises in the tropics, cools and moves towards the poles (shown as 1 on the figure).
|
|
Exchange of air between the stratosphere and the troposphere can occur if layers of constant (potential) temperature cross the tropopause (point 2 on Figure 1) or if there are disturbances and convective transport occurs in the mid-latitudes (point 3).
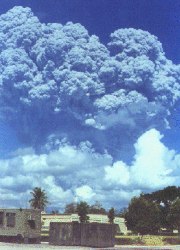
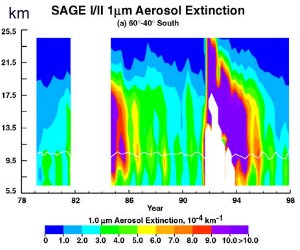
Vertical air exchange in the troposphere takes hours to days whereas mixing in the stratosphere takes months to years, This is why, after large volcanic eruptions such as Mount Pinatubo in 1991, it can take between one and two years for the stratosphere to return to its stable state. Have a look at the illustrations below to see the impact of this eruption.
The small stratosphere-troposphere-exchange (STE) is an important source of ozone from the stratosphere to the troposphere. Stratospheric ozone initiates hydroxyl (OH) radical formation and the cycles of photochemical formation and destruction of ozone in the troposphere.
|
 |
The tropospheric ozone budget
There is a cycle of ozone formation and destruction in the troposphere. The major driver of this cycle is inputs of ozone from the stratosphere.
| Production/loss process |
Tg / year |
| Transport from the stratosphere |
+ 600 |
| a) Photochemical formation |
+ 3500 |
| b) Photochemical destruction |
- 3400 |
| Sum a+b: Net in situ ozone formation |
+ 100 |
| Deposition to the ground |
- 700 |
|
|
 |
 |
|
2. a) Eruption of Mt. Pinatubo in the Philippines in June 1991.
|
|
 |
 |
 |
|
2. b) Aerosol absorption: Absorption by particles in the atmosphere after the eruption of Mt. Pinatubo in June 1991 immediately increased with the eruption and decreased only slowly over the next 2-3 years. The figure shows that particles reached the stratosphere. Data from SAGE I + II, please click to enlarge! (50 K)
|
|
 |
 |
|
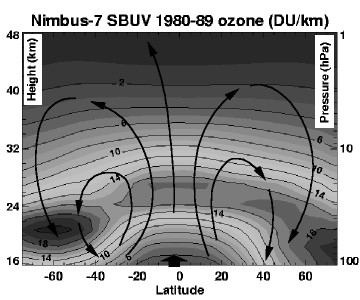
3. The average annual flow of the Brewer Dobson Circulation shows that air moves from the Tropics (in the middle) to the poles. An average ozone distribution for the year is laid underneath and shows that ozone accumulates in the polar regions. The north pole is on the right. Data source: Nimbus 7 website.
|
|
 |
Brewer Dobson Circulation
The pattern of air movement around the atmosphere is known as the Brewer Dobson circulation. Since the processes which control this circulation pattern (the radiation budget of the Earth, planetary waves, subsistence processes in the polar vortex) are very complicated, we won't go into them in detail here. Very simply, air rises in the tropics and sinks at the poles, each hemisphere has its own circulation and exchange of air between the hemispheres is poor.
|
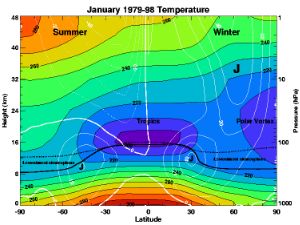
There are slight differences in how the air circulates in the Northern and Southern hemispheres. In the north, the distribution of oceans and land masses is more inhomogeneous than in the south and the polar vortex is weaker. In addition, seasons have to be taken into account. Figure 3. shows the average circulation through the year, but as the seasons and angle of the Sun change over the year, the position where air rises in the tropics shifts either to the north or to the south. Figure 4. shows how the temperature and wind patterns vary between the two hemispheres in January, this in turn causes the Brewer Dobson circulation to vary.
|
 |
 |
 |
|
4. Temperature and wind distribution in an atmospheric cross-section for January (= winter in the northern hemisphere, right hand part of the image). Note the cold tropopause over the tropics and the formation of a polar vortex over the Arctic region. Source: © NASA Goddard Space Flight Centre 2002. Click on the image to enlarge.
|
|
Polar Vorticity
The polar vortex (very simply, a whirlwind) is a circumpolar wind which forms over both poles, more often over the Antarctic continent than over the Arctic. The Arctic vortex is less stable since the alternating surface of oceans and continents on the Earth disturbs the formation of the vortex. Very low temperatures can be reached within the Antarctic vortex and air from higher regions (containing compounds responsible for ozone hole destruction) can be sucked down to lower altitudes by the wind.
|
About this page:
author: Dr. Elmar Uherek - Max Planck Institute for Chemistry, Mainz, Germany.
educational proofreading: Michael Seesing - Uni Duisburg, Germany - 2003-08-07
last published: 2004-04-20
|
|
 |
|


