|
|
 |
|
|
|
 |
| |
|
|
 |
Lower Atmosphere
Read more |
Measurement techniques - spectroscopy
Concentrations of trace gases in the atmosphere are very very low. In this section we look at the measurement techniques we use to determine the levels of trace gases in air.
|
|
|
|
|
 |
|
The two most common methods used for the analysis of air, either in the laboratory or outside, are:
a) spectroscopy - based on how different molecules interact with light
b) chromatography - based on how different molecules react with each other.
|
 |
 |
|
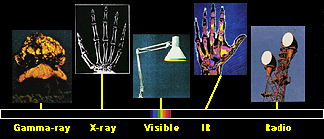
1. The electromagnetic spectrum consist of different sorts of electromagnetic waves with different energies. We can use most of them to investigate the character and the concentrations of different molecules in the air. Source and further information about the electromagnetic spectrum: from NASA.
|
|
 |
The character of radiation
By using radios, microwaves, tanning salons and having X-Ray examinations we know that there are lots of different types of radiation in the air, all with different energies and only some of them visible as light. These different forms of radiation altogether form the electromagnetic spectrum. The least energetic form are the radiowaves, followed by microwaves, infra-red radiation, visible light, ultra-violet radiation and X-Rays with the most energetic being gamma rays. As the energy of the radiation increases, the frequency increases and the wavelength decreases. Nearly all these different forms of radiation interact with molecules and, from the way they do this, we can identify the chemical species present in the atmosphere.
|
|
Wavelength, frequency and energy of the different regions of the electromagnetic spectrum:
|
|
Wavelength (m) |
Frequency (Hz = s-1) |
Energy (J) |
|
Radio |
> 1 x 10⁻¹ |
< 3 x 10⁹ |
< 2 x 10-24 |
|
Microwave |
1 x 10⁻³ - 1 x 10⁻¹ |
3 x 10⁹ - 3 x 10¹¹ |
2 x 10-24- 2 x 10-22 |
|
Infra-Red |
7 x 10⁻⁷ - 1 x 10⁻³ |
3 x 10¹¹ - 4 x 10¹⁴ |
2 x 10-22 - 3 x 10-19 |
|
Optical |
4 x 10⁻⁷ - 7 x 10⁻⁷ |
4 x 10¹⁴ - 7.5 x 10¹⁴ |
3 x 10-19 - 5 x 10-19 |
|
Ultra-Violet |
1 x 10⁻⁸ - 4 x 10⁻⁷ |
7.5 x 10¹⁴ - 3 x 10¹⁶ |
5 x 10-19 - 2 x 10-17 |
|
X-Ray |
1 x 10-11 - 1 x 10⁻⁸ |
3 x 10¹⁶ - 3 x 10¹⁹ |
2 x 10-17 - 2 x 10-14 |
|
Gamma-Ray |
< 1 x 10-11 |
> 3 x 10¹⁹ |
> 2 x 10-14 |
|
Interaction of light and molecules
If a parcel of radiation meets a molecule in the air, it can transfer its energy and change the state of the molecule. Least energy is needed to make the molecule rotate, more to make the bonds move and even more to move the electrons present to higher energy levels.
The amount of energy transfered depends on the molecule, its size and how strongly the atoms of the molecule are bound together. Therefore, if we send radiation into the atmosphere and compare it before and after the air parcel we are looking at, we see that certain fractions of the radiation have been absorbed (consumed) by the molecules. From the character of the absorption we can determine the type and concentration of the molecules present.
|
|
|
 |
So what happens if we emit infra-red radiation of different energies (E) from a source (S) through an air parcel and measure which fraction of the radiation reaches the detector (D)? The different energies (different wavelengths) are shown in different shades of red.
|
|
|
 |
A molecule present in the air absorbs radiation of a particular energy from the source (here two of the six different energies emitted by the source are absorbed by the molecule) preventing it reaching the detector. If we subtract the original energy spectrum emitted from the source from that measured by the detector, we get an absorption peak which is shown on the right. This peak represents the radiation absorbed by the molecule. The more light absorbed, the higher the peak becomes.
|
 |
 |
|
2. a-c) Animations by Elmar Uherek
Please click to enlarge! (30 K)
|
|
 |
Another molecule in the air absorbs radiation as well. The bonds between the atoms in this molecule are, however, stronger so more energy is needed to make them move. As a result, the absorption peak appears at different energy (wavelength) of the spectrum.
|
 |
 |
|
2. d) In contrast to the three images before, we now zoom into a smaller energy range (all the arrows have very similar energies). The weakening of the colours tells us that less light arrives at the detector as the number of molecules present in the air increases. Since the absorption peak is the difference between the radiation emitted by the source and the radiation measured by the detector, the peak grows in size as the amount of radiation reaching the detector decreases.
|
|
 |
From the position of the absorption band we get information on which molecules are present in the air. From the intensity of the absorption band, we can determine how many molecules there are in the air, because the amount of radiation absorbed is proportional to the number of molecules present.
|
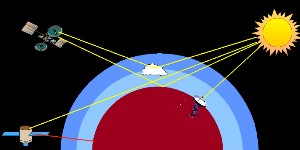
In the atmosphere there are several ways in which we can measure the absorption of radiation. On Earth, we can measure the absorption of ultra-violet and visible radiation from the Sun or reflected back from the Moon. We can also measure infra-red radiation emitted from the Earth's surface using satellites in space. We can also use satellites to measure the amount of solar radiation reflected directly back from the Earth's surface, by clouds or that which passes tangentially through the Earth's atmosphere.
|
 |
 |
 |
|
3. Satellite based measurements of absorption in the atmosphere. Image by Elmar Uherek.
Please click to enlarge!
|
|
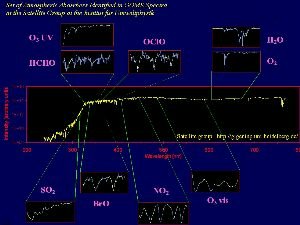
Its not only infra-red radiation coming from the surface of the Earth which can be measured by satellites. It's also possible to measure the concentrations of important inorganic compounds such as ozone, nitrogen oxides and halogen oxides from space. One example is the Global Ozone Monitoring Experiment (GOME) which uses a spectrometer aboard the ERS-2 satellite to measure not only ozone but also nitrogen dioxide, water, sulphur dioxide and formaldehyde (HCHO) in the atmosphere at wavelengths from the ultra-violet, through the visible and into the infra-red (wavelengths from 240 to 790 nm).
|
 |
 |
 |
|
4. Satellelite based spectra of various inorganic compounds in the atmosphere, taken from the GOME instrument. Source: Satellite group, IUP Heidelberg. Please click to enlarge (150 K).
|
|
 |
 |
|
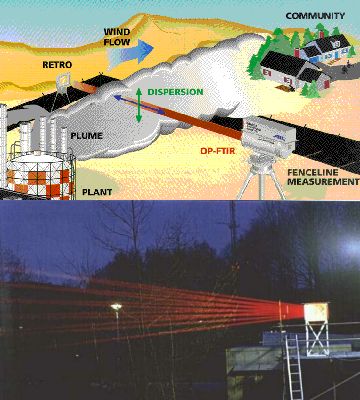
5. Please note: Infra-red radiation isn't visible to our eyes. In the photograph beams can be seen because the light source not only emits infra-red radiation but it also emits in the red part of the visible spectrum.
|
|
 |
We can make similar measurements from the ground. As the concentrations of the chemicals we are interested in are really small, we use mirrors to reflect the radiation beam many times through the air before it reaches the detector. This means that the radiation passes through many kilometers of air and the concentrations of the chemical compounds are high enough for us to measure them.
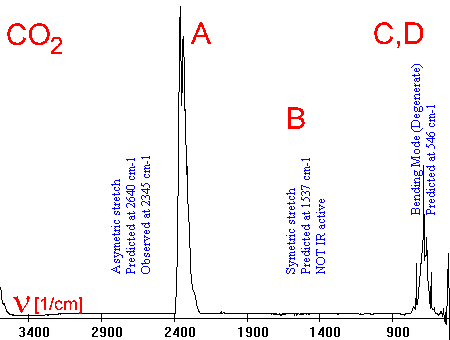
The left hand side image shows such a set-up in theory (image from EPA Field Analytik Technology Encylopaedia) and in practice (photo from FZ Jülich). Here infra-red spectroscopy is used and a simple example of the type of spectrum recorded is given below.
|
 |
 |
|
6. This simple example shows the infra-red spectrum of CO2 together with the activated vibrations. Infra-red spectra can be rather complicated if the absorptions of different molecules overlap or if the molecules are complicated and many vibrations are possible. Spectrum and animations from Scott Van Bramer, Widner University.
|
|
 |
Vibrations:
A asymmetrical stretch

B symmetrical stretch
[not IR active]

C vertical bend

D horizontal bend

|
|
Related pages
If you are interested in the properties of light, have a look at:
Clouds and Particles - Basics - Unit 3 - Rainbows
Find out more about the techniques used to observe the atmosphere at:
Upper Atmosphere - Basics - Unit 1 - Observation
About this page:
author: Dr. Elmar Uherek - Max Planck Institute for Chemistry, Mainz, Germany
scientific reviewing: Dr. Mark Lawrence - Max Planck Institute for Chemistry, Mainz - 2004-05-05
educational proofreading: Michael Seesing - Uni Duisburg, Germany - 2003-07-02
last published: 2004-05-10
|
|
 |
|


