|
|
 |
|
|
|
|
| |
|
|
|
Lower Atmosphere
Read more |
1. Oxidants and observation - more
Worksheet 2: The interrelation of light, absorption and colour
|
|
|
|
|
|
 |
|
|
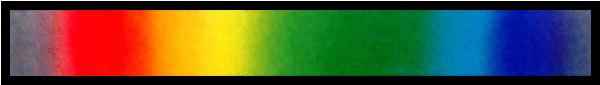
Figure 1: The spectrum of white light.
© 2004 Seesing, Tausch; Universität Duisburg-Essen, Duisburg [Lit:Tausch, von Wachtendonk: Chemie SII, Buchner Verlag, Bamberg 1993]
|
|
Visible light is just one part of the spectrum of electromagnetic radiation. It consists of tiny energy units called light quanta or photons. The energy of a photon is determined by its wavelength. If the same amount of photons of all wavelengths of the visible spectrum reach our eyes, we see the light as white light. An object also appears white if it reflects all the different energy photons back into space. An object appears black if it absorbs all of the different wavelengths of light.
The different wavelenghts of visible light can be separated with a prism or diffraction grating (something with a large number of thin parallel lines - if you move a CD around in the light, this acts like a diffraction grating and you see all the different colours of the light). The light spectrum from a prism has all the colours arranged according to their energies (see Figure 1.).
If a substance absorbs all the wavelengths of light except, for example, red, the red wavelengths are reflected back into space and we see the object as red in colour. If a part of the light of a certain energy is absorbed we see the complimentary colour of the absorbed light.
|
|
|
T 1 |
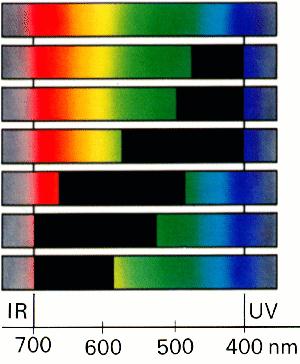
Which visible colour belongs to each of the spectra below? |
|
 |
|
|
© 2004 Seesing, Tausch; Universität Duisburg-Essen, Duisburg [Lit:Tausch, von Wachtendonk: Chemie SII, Buchner Verlag, Bamberg 1993]
|
|
|
|
|
In nature many things appear coloured. Most of them absorb in several areas of the visible spectrum. The amount absorbed in each area is not usually the same (Figure 2). This results in characteristic absorption spectra that can be used to identify different substances. Furthermore, two substances which are made up of the same components can sometimes be of different brightnesses.
|
|
T 2 |
Suggest a hypothesis why two samples of the same substance have different brightnesses and give your reasons. Draw the spectrum of a "darker" chlorophyll b on Figure 2. |
|
|
 |
|
|
Figure 2: absorption spectrum of chlorophyll b
© Tausch, von Wachtendonk: Chemie SII, Buchner Verlag, Bamberg 1993
|
|
Basic spectrometry
Spectroscopy is a technique used to identify different substances. In the laboratory we can find the characteristic spectra of different substances using a spectrometer. Spectrometers are also mounted on satellites which orbit the Earth. By knowing their characteristic spectra, we can identify substances in our atmosphere from space.
Have a look at the spectrum of the atmosphere made by the GOME satellite on the ESPERE page "Lower Atmosphere - more - 1. oxidants"
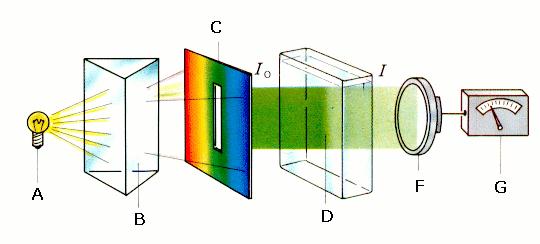
Figure 3. shows what a spectrometer (photometer) is made up.
|
 |
|
|
Figure 3:
Set-up of a photometer A: light source; B: monochromator (prism or diffraction grid); C: aperture; D: cuvette containing the sample; F: photosensor; G: amplifier with calibrated reading showing the EXTINCTION; Io: light intensity in front of the sample I: light intensity behind the sample. The measured EXTINCTION value gives the relationship between the light intensity that has passed (I) through the sample and the original light intensity (Io).
© 2004 Seesing, Tausch; Universität Duisburg-Essen, Duisburg [Lit:Tausch, von Wachtendonk: Chemie SII, Buchner Verlag, Bamberg 1993].
|
Depending on the apparatus and how it is tuned, the measured values are given either as a percentage or logarithmically.
|
|
|
|
There are many adjustable parameters on a spectrometer. Different lamps can be used, particularly when samples absorb in the ultra-violet region of the electromagnetic spectrum. The position of the monochromator can be changed as can the width of the aperture. This allows different wavelengths of light to be shone on the sample. The amount of sample the light shines through (the path length) can also be changed by using different sized cuvettes.
|
T 3 |
What do you have to change exactly and continuously in order to get a spectrum like that shown in Figure 2? Give reasons for your answer. | |
|
The scientists Johann Heinrich Lambert (1728-1777) and August Beer (1825-1863) developed a physical equation that has been named after them, it is known as the Beer Lambert Law:
|
 |
|
|
E: extinction; å molar extinction coefficient (constant that is dependent on the wavelengths and on the character of the absorbing substance); d: path length of the sample; c: concentration of the absorbing substance
|
|
T 4 |
Use your results from T2 and re-interprete them using the Beer-Lambert Law. Which proportionality in relation to the extinction can be experimentally produced and used? |
|
T 5 |
Discuss your results from T 3 and 4! |
|
|
About this page:
authors: M. Seesing, M. Tausch - Universität Duisburg-Essen, Duisburg, Germany
scientific reviewing: Dr. Mark Lawrence - Max Planck Insitute for Chemistry, Mainz - 2004-05-05
last update: 2004-05-13
|
|
|
|


