|
|
 |
Can you answer the following questions?
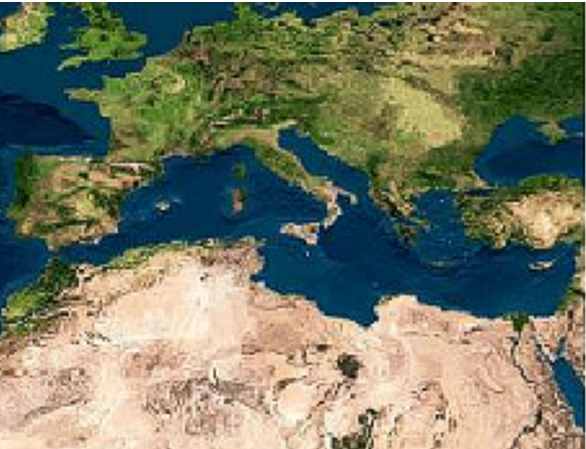
1. This picture shows you the countries of the Mediterranean area. Why are some regions green and others brown?
|
 |
 |
|
1. Normalized deviated vegetation index. G. Begni, MEDIAS-France.
|
|
Click the green button, if you think the statement is correct. Click the red button, if you think the answer is wrong. |
a) There is more farming in the green areas than in the brown.
|
 |
|
b) There is not enough water in the brown areas for irrigation so crops can't be grown in these regions.
|
 |
|
c) There is more vegetation in the green areas than in the brown because rainfall amounts are higher.
|
 |
|
2. Which of the following statements are correct?
|
a) The climate in the countries of the Mediterranean area is characterised by hot dry summers, and cold wet winters.
|
 |
|
b) The climate in the countries of the Mediterranean area is characterised by humid warm summers and cold dry winters.
|
 |
|
c) The climate in the countries of the Mediterranean area is characterised by chilly summers and mild winters.
|
 |
|
3. These diagrams show water consumption in Spain and Norway.
Which diagram belongs to which country?
Click on the question marks to see if you are correct.
|
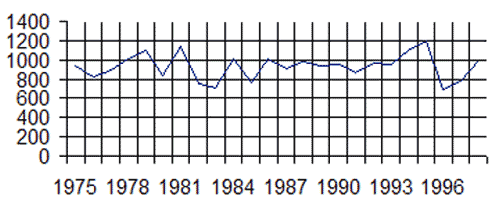
4. This figure shows the annual rainfall in Ravensburg, Germany.
Have a look at the figure then answer the following questions.
If you think the statement is correct, click on the green button. If you think it's wrong, click on the red button.
|
 |
 |
|
3. Annual Precipitation of Ravensburg, Germany. Figure: Sarah Ancot.
|
a) There was a meteorological drought in 1979.
|
 |
|
b) There was a meteorological drought in 1989.
|
 |
|
c) There was a meteorological drought in 1996.
|
 |
|
|
5. Which is correct?
Click on the green button if you think the statement is correct. Click on the red button if it's wrong.
|
a) Meteorological drought leads to a decrease in soil humidity.
|
 |
|
b) The CO2 concentration in the atmosphere decreases as a consequence of meteorological drought.
|
 |
|
c) Hydrological drought is determined by the water level in rivers, lakes and water reservoirs.
|
 |
|
d) Hydrological drought is measured by the water consumed during field irrigation.
|
 |
|
6. Describe “agricultural drought”.
7. Which factors, independent of climate, increase the problems caused by aridity?
8. Even if aridity catastrophes can not be predicted very precisely, there are precautions which can be taken in these areas. Can you name some of them?
|
About this page:
author: Sarah Ancot - University of Nürnberg, Nürnberg, Germany
educational reviewing: Dr. Helmut Schrettenbrunner and Julia Heres - University of Nürnberg, Nürnberg, Germany
last update: 2003-12-16
|
|
 |
|


