|
|
 |
|
|
|
|
| |
|
|
|
Lower Atmosphere
Read more |
The Greenhouse gases - carbon dioxide and methane
Although water vapour is the most important greenhouse gas, it's carbon dioxide and methane that normally make the headlines. The concentration of these gases is far less than that of water vapour but they prevent particular wavelengths of infra-red heat radiation leaving the atmosphere. Their concentrations are also continuously increasing as a result of human activity.
|
|
|
|
|
|
 |
|
|
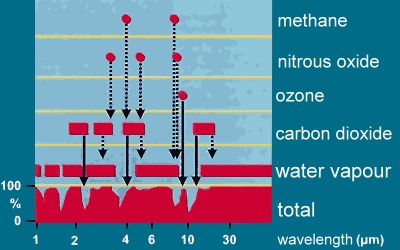
1. Absorption of water and other greenhouse gases. Adapted from: Climate Website of the German Museum.
|
|
|
Water vapour absorbs most wavelengths of the infra-red radiation emitted by the Earth's surface, trapping it as heat. At some wavelengths, however, the absorption is weak or close to zero allowing infra-red radiation to escape into space. Other greenhouse gases absorb infra-red radiation at these wavelengths and reduce the amount of heat lost into space.
|
|
Simply increasing the concentration of water vapour wouldn't have such a large effect on global warming as the presence of small amounts of these other greenhouse gases has. These greenhouse gases are more efficient at trapping particular wavelengths of infra-red radiation than water vapour is.
So, the impact of a particular greenhouse gas on global warming depends not only on its concentration, but also on how efficiently it can trap infra-red radiation. The concept of a Global Warming Potential (GWP) was developed to compare the ability of each greenhouse gas to trap heat in the atmosphere relative to another gas. Carbon dioxide (CO2) was chosen as the reference gas (GWP = 1).
|
|
This table shows some of the most important greenhouse gases, their concentrations in 1750 (preindustrial times), in 2005, their life time in the atmosphere (LT in years) and their 100 year global warming potential (GWP) which indicates how efficient each species is as long term greenhouse gas. Data besides ozone from IPCC AR4 2007:
|
Greenhouse gas |
abundance 1750 |
abundance 2005 |
LT |
100 year GWP |
|
carbon dioxide CO2 |
280 ppm |
379 ppm |
50-200 |
1 |
|
methane CH4 |
700 ppb |
1774 ppb |
12 |
25 |
|
nitrous oxide N2O |
270 ppb |
319 ppb |
114 |
298 |
|
troposph. ozone* O3 |
25 DU
(10 ppb) |
34 DU
(30-40 ppb) |
|
|
|
CFC11 CFCl3 |
0 |
251 ppt |
45 |
4750 |
|
CFC12 CF2Cl2 |
0 |
538 ppt |
100 |
10900 |
1 DU = Dobson Unit = 0.01 mm column of pure ozone
*since ozone is not evenly spread in the atmosphere, only rough assumptions of the average mixing ratios (in ppb) for the lower troposphere can be given.
| |
The change in CO2 emissions over time
Analysis of air trapped within ice has allowed us to look at how CO2 concentrations in the air have changed with time. Over the past 600,000 years atmospheric CO2 concentrations ranged between 180 ppm during glacial times to 280 ppm during the interglacials. This trend changed with the beginning of industrialisation as a result of our increasing exploitation of fossil fuels (coal, oil, gas) as energy sources. Since the industrial revolution, CO2 emissions have increased exponentially and atmospheric concentrations are currently around 385 ppm (2008). This rapid increase in CO2 concentrations is primarily the result of human activity.
|
 |
|
|
2. Trend in the mixing ratios of the greenhouse gases CO2, N2O and methane during the last 600,000 years from the analysis of Antarctic ice cores. The stars top right show the values for the year 2000.
Source: IPCC AR4 2007 fig 6.3
(Please click for a higher resolution.)
|
Every year several billion tons of carbon enter the atmosphere as CO2. In the 1980's 5.4 ± 0.3 Pg C yr-1 was emitted, with this rising to 6.3 ± 0.4 Pg C yr-1 in the 1990's (1 Petagram C = Pg C = 1x10¹⁵ g = billion tonnes). From 1999 to 2005 emissions increased further from 6.5 Pg C per year to 7.8 Pg C yr-1. This corresponds to an annual increase of about 3%, which is beyond the expectations of the world climate report from 2001.
|
The emissions came almost exclusively from the combustion of fossil fuel and from cement production. About 0.5 - 2.7 PgC/year came from land use change, which is primarily burning of forests and other vegetation. We know the magnitude of these CO2 sources fairly well but we are much more unsure about where much of the CO2 goes once it is emitted into the air.
|
|
 |
|
|
5. Atmospheric ratio of the most important greenhouse gases during the last two millenia. Source: IPCC AR4 2007 FAQ 2.1 fig 1
|
|
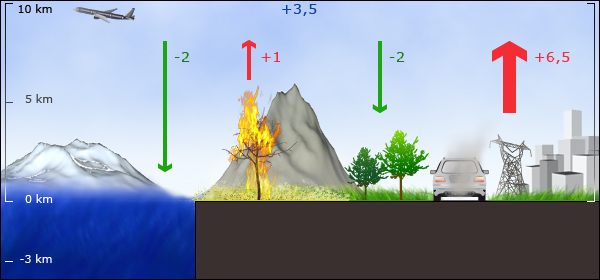
About 3.5 ± 0.1 Pg C y-1 remains in the atmosphere. The oceans take up about 2 Pg C y-1 converting much of the carbon into carbonate and we assume that around 2 Pg C y-1 is taken up by growing vegetation. The amount of CO2 taken up by plants is particularly uncertain; it can easily vary by a factor of 2 from year to year and is related to different weather conditions and, for example, if an El Niño event occurs.
|
 |
|
|
6. The CO2 budget: Estimated average values for CO2 sources and sinks for the 1980's in PgC y-1. Fossil fuel burning and land use change are the major sources, vegetation and the ocean are the major sinks. Image by Anja Kaiser © ESPERE, Data from: IPCC TAR 2001 / AR4 2007
|
|
|
|
The carbon cycle
Exchange of CO2 between the biosphere and the atmosphere is on a much larger scale than indicated by the source and sink values shown above. About 270 Pg C y-1 is temporarily stored in plants during photosynthesis and about 60 Pg C y-1 fuels annual plant growth. This natural carbon cycle is in equilibrium so that all of the carbon stored temporarily and all the carbon which is needed for growth is returned to the atmosphere when the plants die and decompose or when they are burnt during biomass burning. This means that natural plant growth does not significantly alter CO2 levels in the atmosphere. Rather, it is the additional CO2 entering the atmosphere as a result of human activities that alters the natural equilibrium of the carbon system.
|
|
The globally averaged concentration of methane in the troposphere in 2005 was 1774 ppb. However, the magnitude of the exact sources are uncertain since emissions from wetlands are very variable and emissions from rice paddies have probably been overestimated (they may be just 40 Tg y-1). The table below gives estimates of methane emissions from two different studies.
|
|
Sources of methane (global emissions in Tera grams per year - 1 Tg = 1012 g):
|
Source (selected) |
Emissions [Tg CH4 yr-1]
(Hein et al., 1997) |
Emissions [Tg CH4 yr-1]
(Lelieveld et al., 1998) |
|
wetlands + rice |
325
(237 + 88) |
225 |
|
energy sector |
97 |
110 |
|
ruminants |
90
(including waste treatment) |
115 |
|
landfills |
35 |
40 |
|
biomass burning |
40 |
40 |
|
others |
- |
(70) |
|
Total |
587 |
600 | |
|
 |
|
|
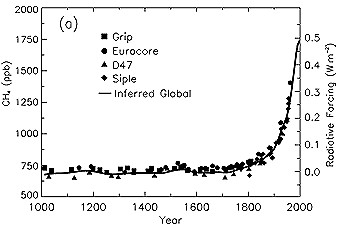
8. The change in CH4 concentrations in the atmosphere over time (mole fraction, in ppb = 10-9) determined from ice cores, firn, and whole air samples plotted for the last 1000 years. Radiative forcing, approximated by a linear scale since the pre-industrial era, is plotted on the right axis. Source: IPCC TAR Fig. 4-1.
|
|
|
About 60% of methane emissions come from human activities such as agriculture, fossil fuel use and waste disposal. As a result of the growing contribution from human activity, the concentration of methane in the air has more than doubled over the past 1000 years.
The most important loss reaction for methane is the reaction with OH:
OH + CH4 -> CH3 + H2O
But the reaction is rather slow and, as a result, the atmospheric lifetime of methane is long, around 8.4 years.
|
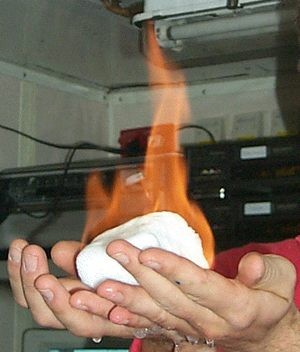
Methane hydrates
Enormous amounts of CH4 are stored on Earth as methane hydrates. These are solid mixtures of ice and methane which are stable at high pressures and low temperatures and found under the oceans and in deeper layers of permafrost soil. About 10,000 Pg of carbon is estimated to be stored as methane hydrates, about double the amount of carbon stored as conventional fossil fuels (coal, oil and gas), so they represent a huge unused energy resource. Data from the Vostok ice core shows no evidence for large scale methane releases from these hydrates over the last 400,000 years. However, increasing surface temperatures as a result of global warming, may melt some of these methane hydrates releasing methane into the air and further enhance the greenhouse effect.
|
|
|
About this page:
author: Dr. Elmar Uherek - Max Planck Institute for Chemistry, Mainz, Germany
scientific reviewing: Dr. Benedikt Steil - Max Planck Institute for Chemistry, Mainz, Germany
educational proofreading: Michael Seesing - Uni Duisburg - 2003-07-02, Yvonne Schleicher - Uni Erlangen, Germany
last published: 2008-10-09
|
|
|
|