|
|
 |
|
|
|
|
|
|
|
|
Context: Simple models
|
Key words:
modelling, simple models, radiation budget, carbon balance | |
|
 How can climate factors be described with a formula? How can climate factors be described with a formula?
The environment around us follows physical laws. These laws are expressed in equations. Nature around us is certainly very complicated. It is much easier to say how much energy is needed to warm up one litre of water from 10°C to 11°C than to describe the climate system in equations. But we can show with a few simple models how it works in general.
|
|
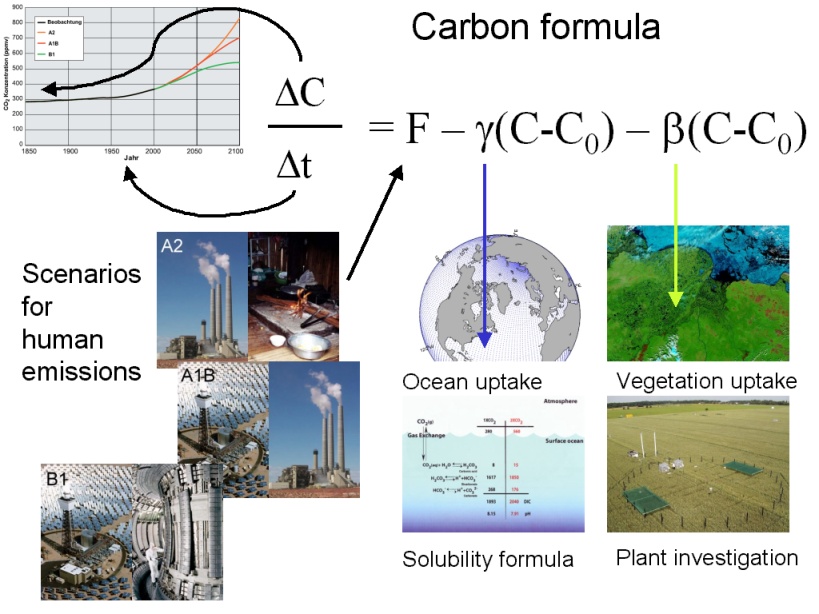
Example 1: A carbon balance equation
Since the beginning of the industrial revolution we have been using more and more so called fossil fuels like coal, oil and natural gas in order to produce goods and heat our houses. One product of the combustion process is the greenhouse gas carbon dioxide (CO2). Often it is measured in tons of carbon atoms, C, we added to the atmosphere. But not every ton of C added as CO2 to the air remains there forever. Plants take up CO2 in order to grow (sometimes more than they release when they die) and a lot of carbon dioxide is dissolved in the oceans. We can express this in a simple carbon balance equation.
|
 |
|
|
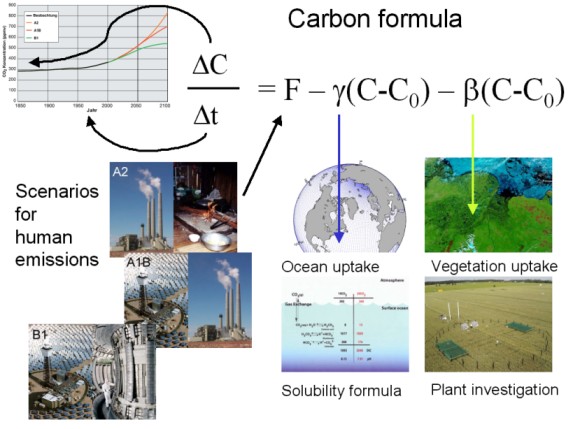
1. Carbon formula: How to predict the future change in carbon dioxide in the air
The carbon content in the air (as carbon dioxide) will change in the future with time. Climate models give us a curve in which this change in carbon with the change in time is estimated. This is the term on the left side of the equation. But on which factors does this depend?
First we have the human emissions F. For the past we roughly know how much we emitted. For the future an estimation has to be made from different scenarios. From the total amount emitted by humans over time we need to subtract a fraction which is taken up by the plants (beta) and a fraction taken up by the oceans (gamma). The uptake coefficients have to be multiplied with the amount of carbon which has been added, it means the difference between the present carbon amount C and the preindustrial carbon amount C0.
Scientists get gamma from a solubility formula and try to estimate beta by plant investigations.
|
|
Example 2: Intensification of the water cycle
Climate models say that we will have on average more and stronger rain in a warmer world. Why is this?
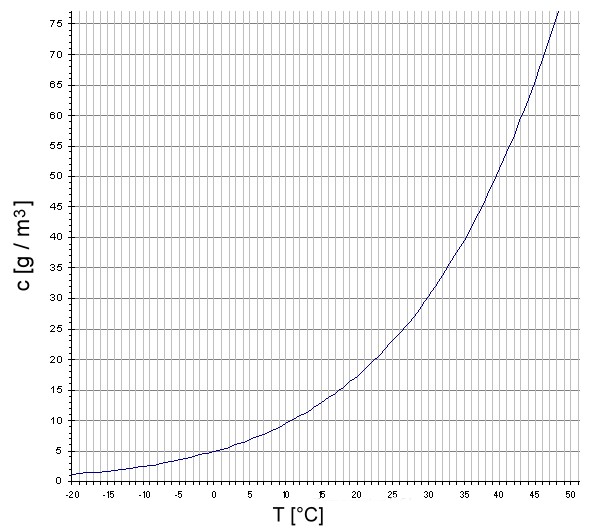
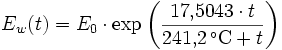
Warm air can hold more water than cold air. This can be demonstrated by the saturation curve. The equation for this is rather complicated.
|
Behind this are thermodynamic expressions like the Claudius-Clapeyron formula:
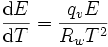
or, simplified, the Magnus formula:
It is not necessary to understand the formula in detail but it is an exponential relation of the type
E (t) = E0 exp f(t)
So the maximum water content of the air increases exponentially with the temperature.
|
|
 |
|
|
2. The water vapour saturation curve tells us the maximum amount of water the air can hold at a particular temperature (a relative humidity of 100%). Please click to enlarge.
|
|
 |
|
|
3. Mean annual cycle of global mean land-surface precipitation with (black line) and without (red line) consideration of different length of month.
Authors: Jürgen Grieser, Christoph Beck; German weather service. Please click to enlarge.
|
|
|
If the average energy close to the Earth's surface increases and more water evaporates then more water will also fall down again. The water cycle intensifies. However, it cannot easily be concluded from this that we will also have more rain over land. Most water evaporates over the oceans and it depends on the global wind systems as to where it comes down again.
|
|
Although the average temperature has increased over the last 50 years, it has been shown by an analysis of precipitation measurements that there is no trend for the precipitation over land. Strong volcanic eruptions decrease the average precipitation for more than one year, but no conclusions can be made for the general temperature change.
|
 |
|
|
4. Time series of annual mean monthly precipitation sums of the global land surface (Greenland and Antarctica omitted). Blue line: linear trend for the whole period 1951 to 2000, green line: linear trend for the period 1973 to 1987, red line: linear trend for the period 1991 to 2000
Authors: J. Grieser, C. Beck; German weather service. Please click to enlarge.
|
|
The land surface investigated (excluding Greenland and Antarctica) however makes up only 25% of the Earth's surface. From this we can anticipate that is it not easy to say in which way an intensification in the global water cycle will concern us in the future, although the simple formula and curve above seems to give an easy answer: more rain.
Example 3: A simple Earth energy model
The energy driving our climate system and keeping the Earth warm enough for living comes from the sun. But the Earth needs to send this energy back, otherwise it would become warmer and warmer. Can we express this process in equations?
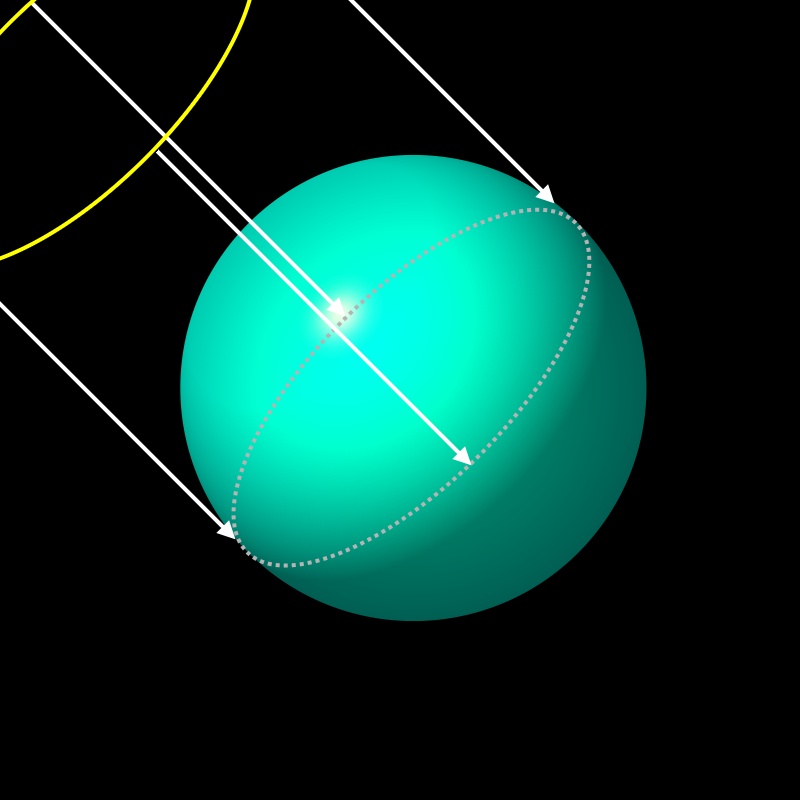
We assume the sun is sending energy to our planet in nearly parallel rays. This is the solar constant L. It is given in power per area and has a value of about 1366 W/m2. If there were no reflection, one quarter of this energy hits each square metre of the atmosphere of the Earth.
Why is it one quarter?
This is because the full energy does not vertically hit the full Earth surface, but only the cross section of the Earth. We know that half of the Earth is always in the night and the sun radiation under a low angle is weaker. Since the cross section of a sphere is one fourth of the surface of a sphere the total energy on the Earth surface is R = 1/4 L = 342 W/m2.
|
|
A fraction of the solar radiation however is not taken up by the Earth surface, because it is reflected, for example by clouds, ice and snow. We call this fraction the Earth’s albedo A and it is in the range of 30% of the incoming solar radiation. Therefore, the incoming energy is:
|
|
The temperature on Earth would continuously increase if the incoming energy would not go out again.
We know from the Stephan-Boltzmann Radiation law (for blackbody radiation) that the rate at which energy is lost by outgoing infrared light can be calculated as a simple function of temperature:
|
|
Sigma is the Stefan-Boltzmann constant, and Te is temperature of the surface of the Earth.
Consequently, we can describe the equilibrium with the following equations:
|
This is the basic energy balance of the Earth without greenhouse gases. If we count in the greenhouse gases a fraction of the infrared radiation on the right side of the equation is sent back, as shown in the figure on the right, but also the Earth's surface temperature increases. The equations become a bit more complicated, but we can imagine that the system can be mathematically described.
|
|
|
 |
|
|
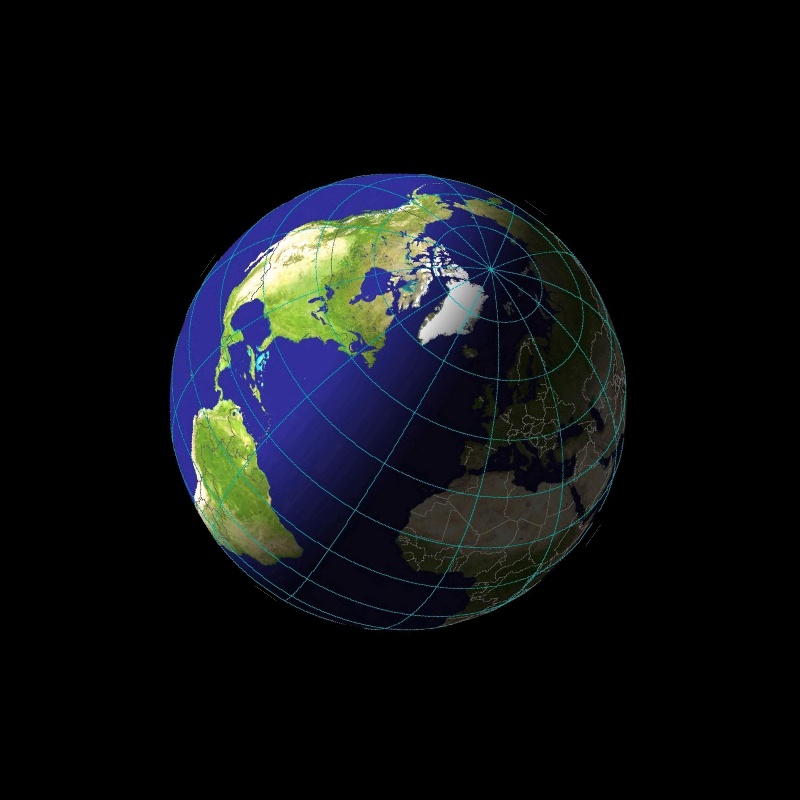
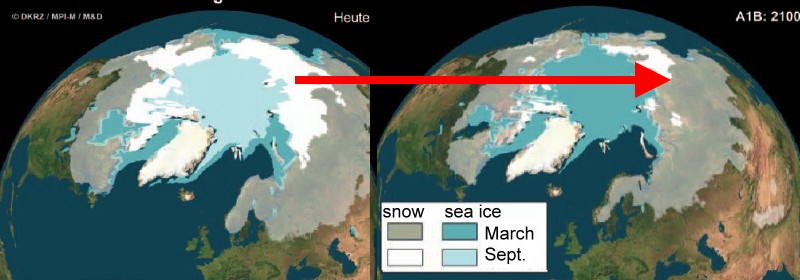
8. Melting in the Arctic © MPI Met
|
|
|
Global warming causes a melting of polar ice areas. This changes the reflection of sunlight by the Earth, a part of the albedo, A, and therefore changes the radiation balance of our planet.
|
Author:
Elmar Uherek - Max Planck Institute for Chemistry, Mainz
English check: Mark Jacob, TU Freiberg
|
|
|
|