|
|
 |
3. Radiation budget
Worksheet 2
|
|
Earth receives solar energy mainly in the form of light from the sun. Light is a form of electromagnetic radiation. The light radiation heats up the ground, an in turn, our planet loses energy by emitting infrared radiation towards space. Altogether, the amount of energy we receive from the Sun must equal the energy we radiate into space otherwise our planet would quickly heat up!
But are flows of light radiation (in) and heat radiation (out) in equilibrium in all areas of the world? In order to answer that question, let us examine satellite measurements of energy flows to and from the Earth.
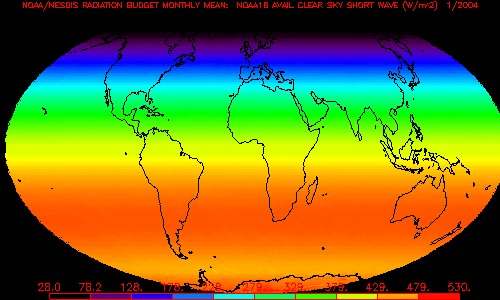
1. Incident solar energy striking the Earth
The image below shows the average radiation energy from the sun striking the Earth in January 2004 (measured in watt per square meter).
- Is the energy equally distributed over the Earth's surface?
- Upon what is it dependent?
- What is the average value in your country for that month?
|
 |
|
|
Average energy Earth receives from the sun in one day in January 2004. Photo: NOAA
|
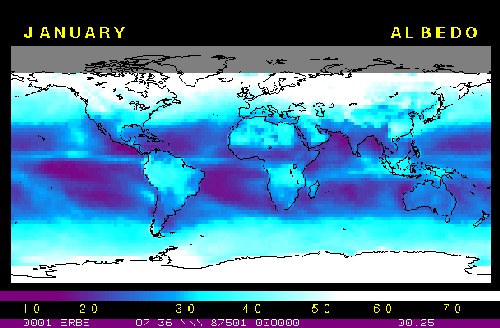
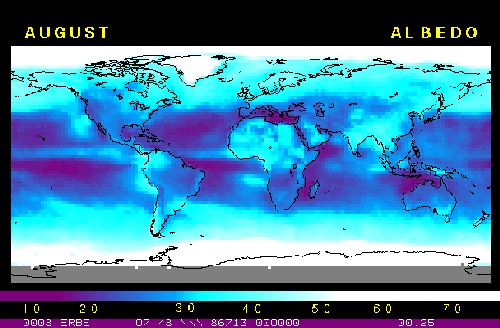
2. Measurement of albedo
Look at the two images below showing the reflected fraction (albedo) of solar energy (in percent) in January and in August.
- Which areas have the lowest albedo? The greatest?
- What is the mean albedo value over your country in January? In August?
|
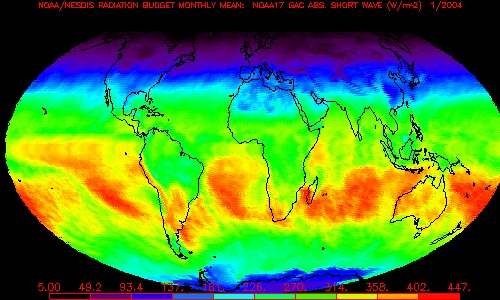
3. Absorbed solar energy
The image below exhibits the average amount of radiation energy from the Sun that is absorbed by the Earth (in W/m²) in January 2004. It is calculated from the incoming solar radiation subtracting the amount of energy that is reflected (albedo). Look at it:
- Some areas absorb a lot of energy. Where are they located?
- Other areas absorb a small amount of energy. Where are they located?
- What is the amount of radiation energy absorbed in your country?
|
 |
|
|
Radiation energy from the Sun absorbed by the Earth (in W/m²) in January 2004. Photo: NOAA
|
4. Summing up information from points 1-3, complete the sentences:
Areas of the Earth which absorb the greatest amount of solar energy are the areas that receive the
incident energy and which have the
. albedo. These areas are located at/around
.
. (and
..).
Areas of the Earth which absorb the lowest amount of solar energy are the areas that receive the
incident energy and which have the
. albedo. These areas are located at/around
.
. (and
..).
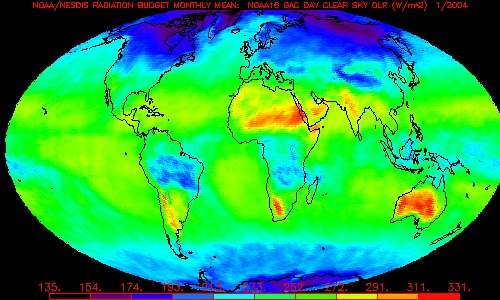
5. Emission of energy
The absorbed radiation from the sun (mainly light) heats up the ground and oceans, an in turn, our planet loses energy by emitting infrared radiation into space. Altogether, the amount of energy we receive from the Sun must equal the energy we radiate into space otherwise our planet would quickly heat up or cool down!
Look at the image below. It shows the mean energy emitted during daytime in January, 2004. Units are watt per square meter.
- Which areas emit the greatest amounts of energy?
- Which areas emit the least energy?
- What is the radiative energy emitted in your country?
|
 |
|
|
Average energy emitted during daytime in January, 2004 (W/m2). Photo: NOAA
|
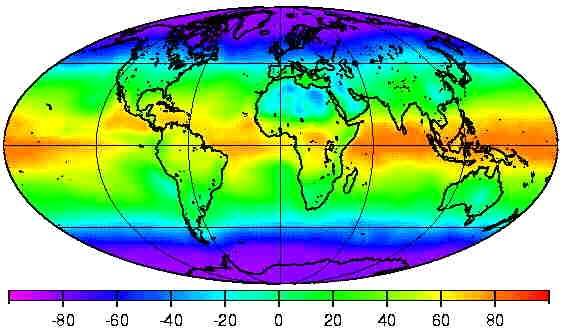
6. Conclusions: the radiative budget of different areas on Earth
The Earth absorbs energy from the sun and re-emits infrared radiation. The difference between incoming solar radiation energy (that warms the planet) and outgoing infrared radiation energy can be calculated (based on images like the ones presented in this worksheet) for each area of the world. On a global scale, the incoming energy is the same as the outgoing, but this is not always the case on a local scale.
The image below shows the annual average radiative budget for different areas of the Earth in W/m².
- Draw a straight line where the radiative budget is in equilibrium (equal to zero).
- In which areas is the budget positive, and in which areas is it negative?
- Look for example the radiative budget over Europe. Is it positive or negative? Is it in accordance with your previous conclusions?
- What can you observe concerning the Sahara desert? How can you explain it?
- You would expect that areas with a positive radiation budget would become hotter and hotter, whereas areas with a negative budget would become cooler. Do you know of any mechanisms / processes that counteract such an effect?
|
 |
|
|
Earth's annual average radiative budget (W/m²). Photo: NOAA
|
|
All images on this worksheet are from the National Oceanic and Atmospheric Administration, NOAA. If you want to know the radiation values for a particular day, you can look them up at the NOAA website:
 http://www.osdpd.noaa.gov/PSB/EPS/RB/RB.html http://www.osdpd.noaa.gov/PSB/EPS/RB/RB.html
Thanks to http://www.educnet.education.fr/ for the idea for this worksheet |
Authors: Ellen K. Henriksen and Camilla Schreiner - University of Oslo - Norway. Scientific reviewer: Justine Gourdeau - LaMP Clermont ferrand - France - 2004-01-13. Last update: 2004-03-27.
|
|
|
|