|
|
 |
|
|
|
|
| |
|
|
|
Food & Climate
Basics |
Types of drought
We can distinguish three main types of drought depending on the aspects we attend to:
· Meteorological drought: precipitation levels
· Hydrological drought: levels of water in reservoirs
· Agricultural drought: available water for crops
|
|
|
|
|
|
Meteorological Drought
Meteorological drought is defined usually comparing the precipitation of a precise place and moment to the average of precipitation of that place for a long period. This is why the definition is specific to each region.
Meteorological drought results in depletion of soil moisture that almost always has an impact on crop production.
We only consider the objective factor of reduction of precipitation, not taking into account the effects of that reduction on water reservoirs, human needs or agriculture.
|
|
 |
|
|
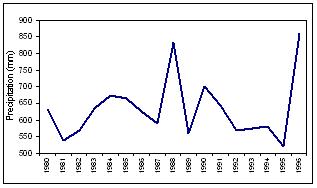
1. Yearly averages of precipitation in Spain
Adapted from "Libro Blanco del Agua" Spain
In this graph you can easily see which were the years with the lowest precipitation in Spain, in the first half of the nineties the whole country suffered one of the worst droughts in many years, being the year 95 the one with minimum precipitation.
|
|
|
Over the last three decades spring rainfall has decreased in many Mediterranean areas causing severe problems associated with drought because of the reasons explained before (more population, more demand of water).
Over the period 1951-2001 precipitation decreased in most areas of the Spanish territory, specially in the centre and south. Drought affected more people than any other natural disaster over the same period. Over 6 million people were affected by the severe drought, which had its hardest year in of 1995.
|
 |
|
|
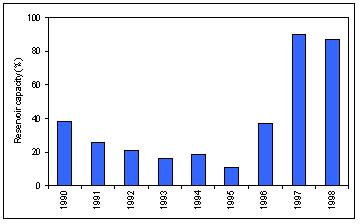
2. Reservoir levels
From CEDEX
In this picture you can see how the drought that affected Spain during the first half of the nineties also had a consequence on the level of the reservoirs in the country, in the year 95 the volume of water held in the reservoirs was only about 10% of their real capacity.
|
|
|
Hydrological Drought
Hydrological drought is associated with the effects of periods of rainfall shortfalls on the water levels of rivers, reservoirs and lakes, and aquifers. Hydrological droughts usually are noticed some time after meteorological droughts. First precipitation decreases and some time after that, levels of rivers and lakes decrease.
This kind of drought affects uses that depend on the levels of rivers, reservoirs, lakes, and aquifers, such as: hydroelectric power production, recreational uses, ecosystems, industry, urban areas, irrigation, etc. |
Agricultural drought.
Occurs when there is not enough water available for a particular crop to grow in a particular time. This drought doesnt depend only in the amount of rainfall, but also on the correct use of that water. Imagine there is a period of low rainfall and also water is not used in the correct way for irrigation and other uses, then the problem becomes even bigger than it was before.
Agricultural drought is typically evident after meteorological drought (when rainfall decreases) but before a hydrological drought (when the level of rivers, lakes and reservoirs decreases).
It is important to mention that the effects of droughts are different in Irrigated and non-irrigated agriculture. In the first one the impacts are usually lower as it depends on stocks of water (reservoirs), so in case of not having precipitations, these crops still get the water they need, in the second case, crops depend directly on water falling as precipitations, if these are reduced, they dont get the water they need to survive.
|
 |
|
|
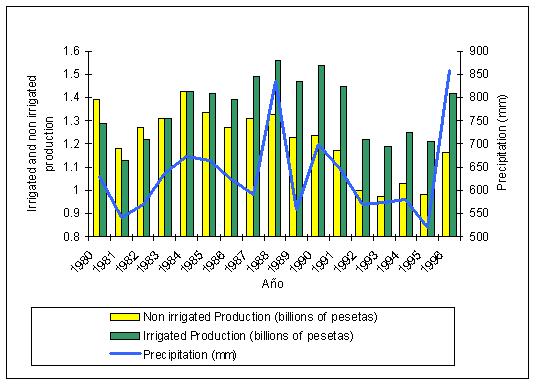
3. Precipìtation and agricultural production
Adaped from Libro blanco del Agua Spain
This graph shows the total precipitation for different years in Spain and the total agricultural production (irrigated and non irrigated agriculture). Here we can appreciate, as we saw in the other figure, that year 95 was the hardest one. Here you can also see that, and check how low agricultural production was in that year too.
|
Author: Marta Moneo and Ana Iglesias- Universidad Politécnica de Madrid - España
1. Scientific reviewer: Alex de Sherbinin - CIESIN, Columbia University - USA
2. Scientific reviewer: Lily Parshall - Goddard Institute for space studies, Columbia University - USA
Educational reviewer: Emilio Sternfeld - Colegio Virgen de Mirasierra - España
Last update: 12/05/2004 |
|
|
|