|
|
 |
|
|
|
|
| |
|
|
|
Lower Atmosphere
Read more |
3. Ozone and fire - more
Worksheet 2: A model experiment on photochemical smogs
|
|
|
|
|
|
|
Some chemicals used in this experiment are harmful. Take care and use protective equipment!
|
 |
|
|
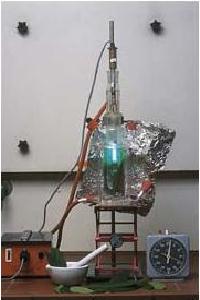
Figure 1: Model experiment on photosmog.
©Tausch, von Wachtendonk: Chemie 2000+; Buchner Verlag, Bamberg 2001
|
|
|
|
E1 |
Irradiation: (demonstration experiment, work in a fume hood and use aluminium foil to protect everyone from ultra-violet radiation).
Fill a 450-mL-water-cooled immersion-lamp reactor with 2 mL tetrachloroethene [Xn,N; R: 40-51/53; S: 2-23-36/37-61], add glass beads or glass rings so that the liquid level is about 1 cm high and add some fresh leaves.
Turn on the water-cooler and irradiate for 25 minutes with a 150 W -UV- immersion-lamp (high-pressure mercury vapour lamp). |
|
E2 |
Extraction, filtration: (group experiment)
Put cut leaves, quartz sand and methanol [T,F; R: 11-23/24/25-39/23/24/25; S: 1/2-7-16-36/37-45] into a mortar and grind with a pestle. Filter the green solution. Make extracts from irradiated and non-irradiated leaves of the same plant species. |
|
E3 |
Thin layer chromatography: (group experiment)
Divide a TLC-aluminium foil coated with silica gel into two sections. Put a spot of the extract produced with non-irradiated leaves on one section and a spot of the extract from the irradiated leaves on the other. To develop the thin layer chromatogram, use a solvent mixture containing petroleum ether (with a boiling-point range of 30-50°C) [F+,Xn,N; R: 12-51/53-65-66-67; S: 9-16-29-33-61-62], benzine (with a boiling-point range of 100-140°C) [F, Xn, N; R: 11-38-51/53-65-67; S: 9-16-23-24-33-61-62] and 2-propanol [F, Xi; R: 11-36-67; S: 2-7-16-24/25-26] in a ratio of 25:25:5. |
|
In this model experiment the results you obtain will depend on the type of leaves you use and how long you irradiate the solution. Nevertheless your results will be very similar to those shown in Figure 2.
|
T1 |
Which pigments have been damaged or destroyed?
How can you recognise this? |
|
|
 |
|
|
Figure 2: Thin layer chromatogram of extracts produced from non-irradiated (A) and irradiated (B) leaves. [1: point of application; 2,3,4: xanthophylls; 5: chlorophyll a ; 6: chlorophyll b; 7 ß-carotene]
© 2004 Seesing, Tausch; Universität-Duisburg-Essen, Duisburg
|
|
|
|
T2 |
The experiment on leaf damage (E1) is a model experiment for processes that can also occur in nature. The conditions inside the reactor are, however, rather more extreme than the conditions in the troposphere and the stratosphere. Add suitable keywords in the table below (e.g. higher, lower, shorter, longer, different, almost the same, etc.) comparing the processes in the troposphere and stratosphere with the experiment: |
| |
troposphere |
stratosphere |
|
gas pressure
|
|
|
|
composition of the gas mixture |
|
|
|
time of irradiation
|
|
|
|
periodicity of the irradiation (day/night rhythm) |
|
|
|
wavelength of the
light ( l )
|
|
|
|
open / closed system |
|
|
|
dynamics of the gases |
|
|
|
temperature of the gas mixture
|
|
|
|
 |
|
|
Figure 3: Predicted changes in the total ozone column with time as a function of geographic latitude (left) and predicted changes in the vertical ozone distribution over time (right). [Lit.: G. Mégie, Ozon, Springer, Berlin 1989]. © 2004 Seesing, Tausch; Universität-Duisburg-Essen, Duisburg.
|
|
|
T3 |
Interpret the predicted changes in ozone levels shown in Figure 3. Which is more alarming, the change in the total ozone column or the vertical distribution? Give reasons for your answer. |
|
T4 |
Look at the vertical distribution of ozone in 60 years shown in Figure 3.(right). Which phenomenon is represented by the model experiment?
1. ozone hole
2. photosmog
3. ozone hole and photosmog
Give reasons for your answer. |
|
T5 |
ß-carotene has a weak point in its structure that can be attacked very easily by ultra-violet radiation. Figure 4. shows some possible reactions, which of these might have happened in experiment E1? Give reasons for your answer. |
|
 |
|
|
Figure 4: possible reactions of ß-carotene
© 2004 Schmidt, Seesing, Tausch; Universität-Duisburg-Essen; Duisburg
|
About this page:
authors: M. Seesing, M. Tausch - Universität Duisburg-Essen, Duisburg / Germany
scientific reviewer: Dr. Rolf Sander - Max Planck Institute for Chemistry, Mainz - 2004-05-18
last update: 2004-05-13
|
|
|
|


