 |
 |
|
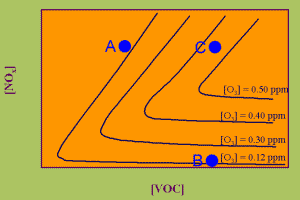
3. Ozone isoplethes - The graph shows the dependence of the formation of high ozone concentrations on the mixture of volatile organic compounds (VOC) and nitrogen oxides (NOx). Images 2+3 are adapted from a lecture given by Mike Hannigan, Univ. of Colorado, Boulder, U.S.A.
Please click to enlarge!
|
|
 |
In a diagram of so called isopleths you see black lines representing the same ozone concentrations. Production of more or less ozone strongly depends on the mixture of nitrogen oxides (NOx) and VOC's (RH) in the air. If levels of NOx are high but VOC levels are low, ozone will not be formed (blue point A) and may even be consumed in the city centre. If levels of VOC's are high but NOx levels are low, ozone concentrations are also low (point B). It is only when both NOx and VOC levels are high that ozone levels increase (point C).
Since ozone levels respond quickly to the local conditions, ozone concentrations vary depending on the time of day, on how much sunshine there is and on NOx and VOC concentrations. This makes it difficult to calculate a global average ozone concentration.
|


