|
|
 |
|
|
|
|
| |
|
|
|
Food & Climate
Basics |
Distribution of crops over the world
The importance of climate for life and plant distribution is one of the better known and earlier appreciated aspects by humans. We can find documents that talk about plants development and distribution which are older than 2000 years.
It is not only natural vegetation which is distributed in a certain way on Earth, but also crops, which need certain conditions of temperature, light and humidity to grow.
|
|
|
|
|
|
Growing characteristics of the main world crops |
|
Characteristics |
Wheat |
Rice |
Maize and Soybean |
Potatoes |
Apples |
Fibre crops |
|
Main Producers |
China India
Europe
Russia |
Asia
China and India |
N. America
S. America
Asia
|
China
N. America
Russia |
China
Europe |
China
India
N. America |
|
Growing Areas |
Cold to temperate |
Temperate to hot |
Temperate to warm |
Cold to temperate |
Cold to temperate |
Temperate to warm |
|
Growing Season |
Winter and/or spring |
All year |
Spring |
All year |
Summer |
Summer |
|
Water needs |
Low |
Very High |
High |
Medium to High |
Medium |
Low |
|
Use |
Flour
Bread
|
Human food |
Human and animal food |
Human food |
Human food |
Clothes and other textiles |
|
Potential climate change impacts |
Moderate: Shift northward growing areas |
Moderate: Shift northward growing areas |
Moderate to high: decrease in productivity from heat stress |
Low: shift the crop growing season and varieties |
Low: Shift northward growing areas |
Moderate to high: decrease in productivity from heat stress | |
|
In the table above you can see how different the needs are for different types of crops. Some of them are adapted to grow in places where temperatures can reach very low values, while others can only grow in warm climates. You can compare the table with the next graph showing the main growing areas for some of the most important crops in the world, which are, Wheat, corn, rice and soybeans.
Some other crops have been added so that you can see how different the areas of growing are.
|
 |
|
|
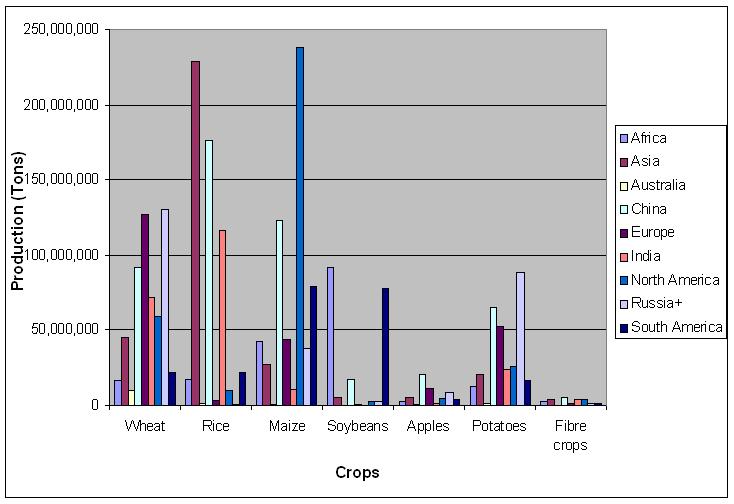
1. World Production of the main crops in the different regions
By Marta Moneo, data obtained from FAO
Click to enlarge (46 K)
|
We will compare now the first table with two maps of average temperature and average rainfall. You can see, for example, how rice is a crop that needs to be cultivated in warm-temperate zones and has very high needs of water, if you look into the graph now you will check that the main producing areas are China and India, and now, looking at the maps you can verify that these are areas with a moderate average temperature and quite a high precipitation along the year.
|
|
 |
|
|
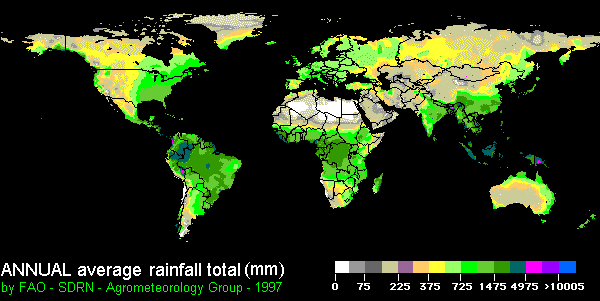
2. Annual average rainfall in the world.
Obtained from FAO
From this picture you can get a rough idea on how precipitations are distributed around the world nowadays, the areas in green are the ones with the highest values of mean precipitation.
Please, click to enlarge (14 K)
|
|
 |
|
|
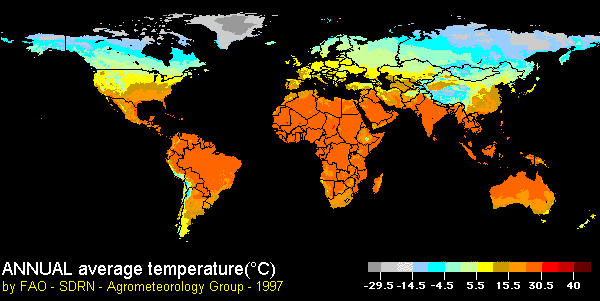
3. Annual average temperature.
Obtained from FAO
In this case the map shows the distribution of mean temperatures in the globe, as you can imagine, the blue areas are the coldest ones, while the red ones are the ones with warmer climates.
Please, click to enlarge (13 K)
|
|
|
Another example is the case of wheat, it is also one of the main crops in the world, but the growing characteristics are very different. It does not have an important need for water supply, it can grow in areas where there is not too much water and also the temperature does not need to be as high as for rice, it can be actually quite low. If you look at the maps and figures now...where is where wheat is cultivated most of all?
|
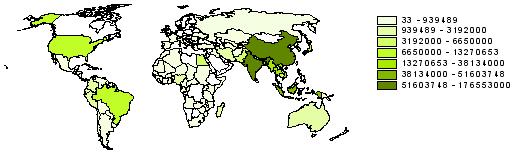
Rice production distribution |
 |
|
|
4. Rice production in the world (tons/year)
By Marta Moneo
This is the map for rice production all over the world. You can check, as we were saying before that the highest production of this crop is in China and India, and comparing this map with those of mean temperatures and precipitation you can easily see that these are areas with quite high precipitation and temperate temperatures that create the optimal conditions for rice growing!
|
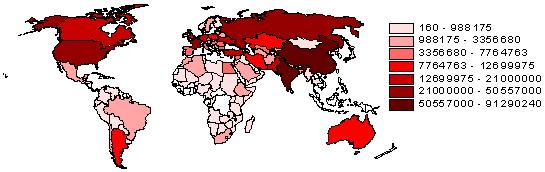
Wheat production distribution |
 |
|
|
5. Wheat production in the world (tons/year)
By Marta Moneo
And we can do exactly the same with wheat. This crop is more adapted any kind of condition, this means that even though it grows bwest with more water, light and warmth, it can also grow in more adverse conditions and, as a result its production is more spread all over the world. In the map you can see that even if it is highly produced in China and India, there is also high production of wheat in Russia, where temperatures and precipitation are much lower
|
Author: Marta Moneo and Ana Iglesias- Universidad Politécnica de Madrid - España
1. Scientific reviewer: Alex de Sherbinin - CIESIN, Columbia University - USA
2. Scientific reviewer: Lily Parshall - Goddard Institute for space studies, Columbia University - USA
Educational reviewer: Emilio Sternfeld - Colegio Virgen de Mirasierra - España
Last update: 12/05/2004 |
|
|
|