|
|
 |
|
|
|
|
|
|
|
|
Albedo and irradiation of surfaces
Different surfaces reflect light more or less, depending on their colour and structure. This means they either take up the energy of the light (absorption), or they send it back (reflection). This is valid for the Earth on a large-scale as well as for many surfaces on a small-scale. White snow and ice reflect most of the sunlight and take up hardly any energy. Oceans, forests and dark grounds take up much more light energy. They become warmer. We can confirm this in an experiment.
|
Materials
Required are:
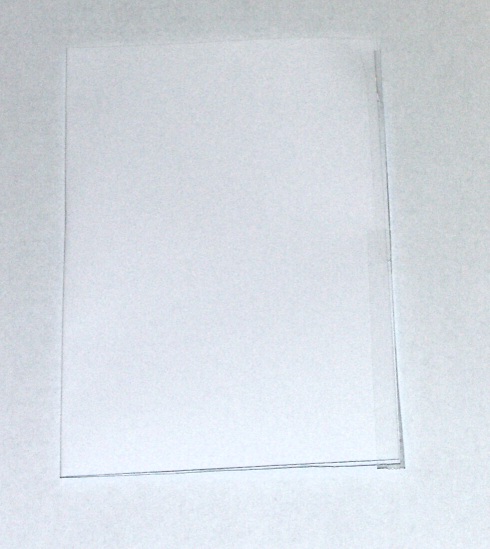
1 white sheet of paper
1 stopwatch
1 spotlight or lamp with directed light
1 thermometer (analogue, digital or thermo sensor)
scotch tape
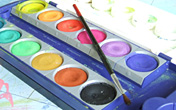
colour and paint brush (for example watercolour)
pencil or biro
millimetre paper or Excel for tabulation and graph
|
|
|
|
|
|
Preparation
Fold a white sheet of paper in half and in half again, so that it ends up a quarter of its original size but in four layers. Paste up now the longer side with scotch tape or a similar adhesive. On the short side you now have a sort of paper bag.
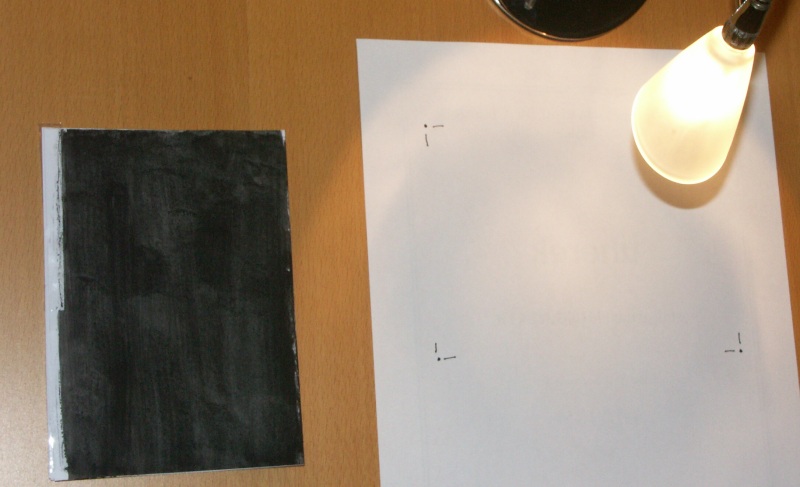
Next we need a white and a dark surface. The paper is already white itself. Therefore, we paint one side of the paper black. Watercolour from your paint box can be used as well as any other paint for walls, but don't use varnish.
|
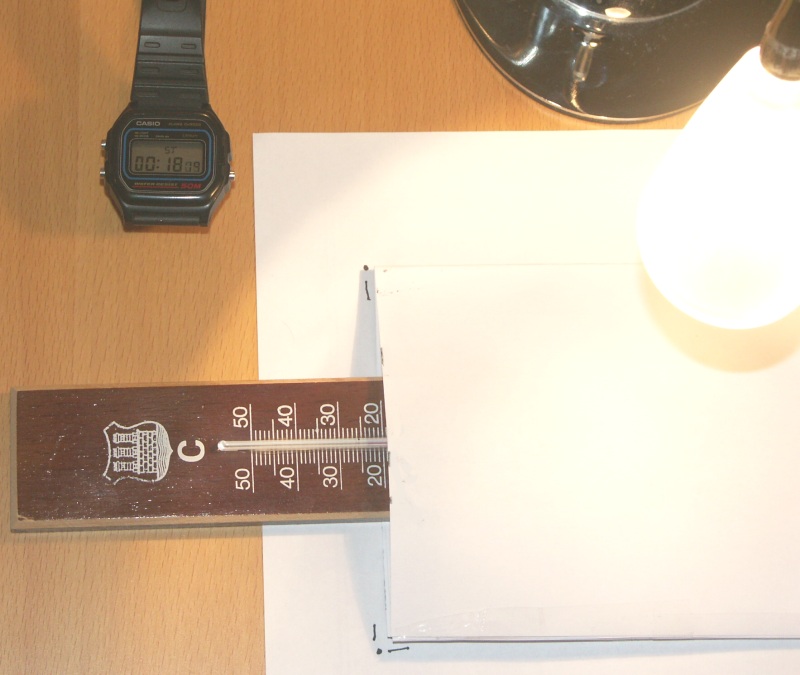
Now you can prepare everything for the irradiation. On a sheet, on your table, mark out the area for the paper bag to be placed. The spotlight should focus about on the middle of this area with a distance of 15 - 25 cm.
Since the following measurement series should be comparable, the position of the spotlight should not be changed and the painted paper should lay once with the white side on top and once with the black side, but always at the same position.
|
|
|
|
|
|
Some lamps do not reach their full output directly after switching them on. Therefore, give about two to four minutes of warm-up time before you put the paper bag with the thermometer under the spotlight. Move the thermometer directly under the irradiated layer. Make sure the position of the thermometer or the thermo sensor is the same in all experiments, so that results are comparable. In the experiment shown it was moved to the 20°C mark into the bag. This way higher values could be read off.
|
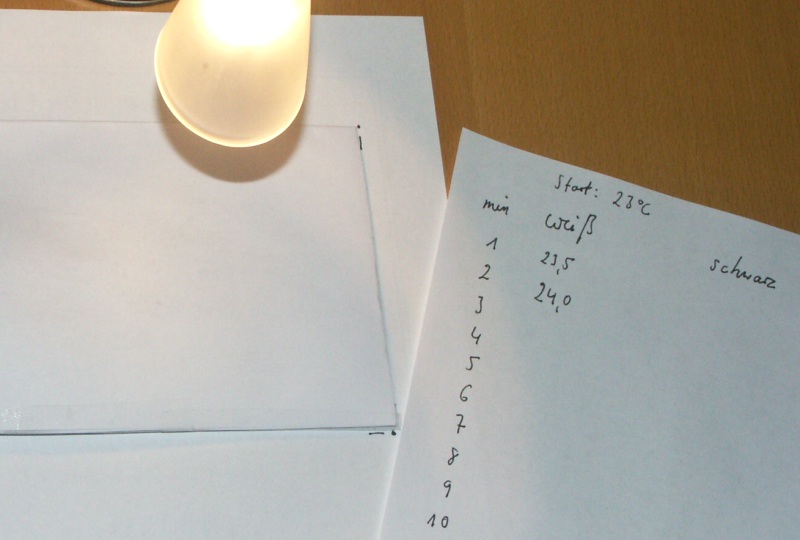
Please note the starting temperature. Start the stopwatch the moment you put paper and thermometer under the lamp. Note the temperature every minute. If you have a standard thermometer with 1°C scale, you may need to guess roughly the first decimal place. Always read off the thermometer from the same angle of view, since you may see a slightly different value from another angle.
|
|
|
|
After about 10 minutes the series with the white paper is finished. Remove the thermometer and give some time for it to cool down again, so that you have a similar start value for the next series. This may take about 10 minutes. Some cool air (e.g. next to an open window) may help to speed up the cooling. Do not leave the paper bag under the lamp during this time.
|
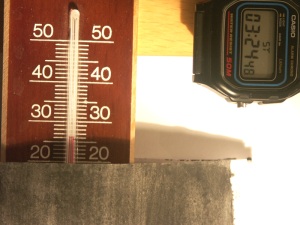
Turn the paper bag over, so that the black side is on top. Move the thermometer under the paper to the same position you had for the first series, but now directly under the black painted layer. Carry out the same measurement again. Do you see a difference?
|
|
|
|
|
|
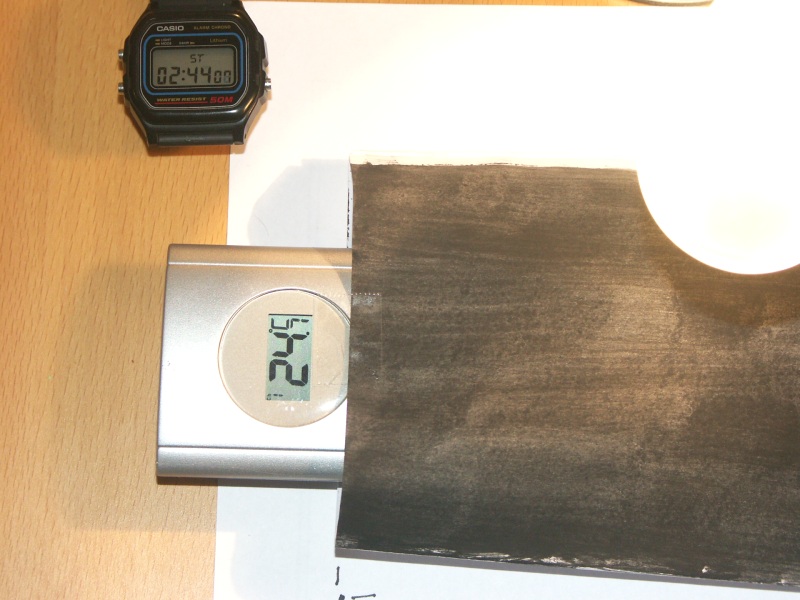
In order to be sure that lamp or thermometer were not warmer at the start of the second series, we repeated the experiment again. This time a digital thermometer from a radio weather station was used. First the black side was irradiated and afterwards the white side. The thermometer had a higher mass and therefore reacted a bit slower. Moreover, temperatur changes were automatically read out in different time intervals. Nevertheless, the results could be well reproduced. This time however, the measurement time took 16 mins since the whole thermometer body had to be heated.
|
|
Analysis
For tabulation and graphs you can either use simple graph paper or millimetre paper. Draw an XY-diagram with the time as x-axis (1 cm = 1 min) and the temperature on the y-axis (1 cm = 1°C). Alternatively you can do the calculations and graphs in a spreadsheet on your computer. We show here the results of our measurements.
|
Extension
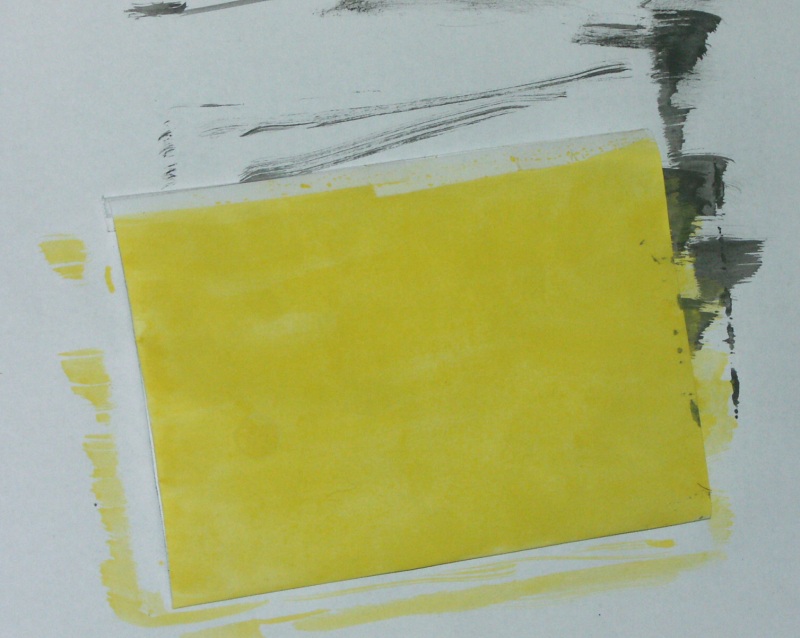
It is the dark colour which determines the energy uptake. If you think that it could be relevant that on one side watercolour has been used and on the other side not, so that the surface type is different, you may carry out another measurement. The light desert areas on Earth have a high albedo. From space they can be seen in yellow colours.
Paint the white side of the paper bag yellow and compare again with the black side.
|
|
|
|
|
|
Here, such a measurement is shown. However, since the measurement was carried out another day, the position of the lamp changed and results cannot be directly compared with the previous four series.
|
|
|
 |
|
|
Thermometer: analogue - comparison black / yellow
|
|
Experimental data and photos on this page: Elmar Uherek |
|
|
|