espere ACCENT online magazine
Printer friendly version of this page
Home    ACCENT Educ.    Science    Encyclopaedia    es    ru    fr    de    it    cn   
Climate Change classes 1
UQ 3 May 07 Cars and ozone
R: Ozone trends
R: More NO2 in cities
F: Particle filters
A: Traffic & immission analysis
A: Example - Ozone and NOx
A: Questions
UQ 2 Mar 07 Urban air
Climate change 2007 IPCC special
UQ 1 Nov Dec 06 Particles in air
Special: Oct. 2006 Communication
Nr 10 Sept. 2006 Africa's emissions
Nr 9 July 06 Air traffic
Special: June 06 Climate summit
Nr 8 April 2006 Ozone & N2 cycle
Nr 7 March 2006 Climate modeling
Nr 6 Feb. 2006 acid rain
Nr 5 Jan. 2006 oceanic sulfur
Special: Nov 05 Ozzy Ozone
Nr 4 Oct. 2005 light/satellites
Special: Sept 05 Cyclones
Nr 3 Sept. 2005 methane/energy
Special: July 05 Greenhouse Earth
Nr 2 June 2005 forest/aerosols
No 1 May 2005 vegetation/CO2
     
Activities

Example:
Ozone and NOx measurements

In the following diagrams we show air quality measurements from different stations in the same region in Germany for the days May 17th + 18th 2007. We compare three different places, one in the vicinity to a busy street (Koblenz), one in a commercial and industrial area next to a medium-sized town (Neuwied) and one in the forest not too far from settlements (Neuhäusel).
 

Where are the stations located?
 
We show Google Earth satellite images of the surroundings. Click on them in order to make them larger.
 

Koblenz - Friedrich Ebert Ring

1. a + b) Koblenz, Friedrich Ebert Ring. The station is indicted by the red circle. It is located not far from the city centre. Image left: Google Earth
Image right: Peter Jansen, licenced for Panoramio.com

Koblenz Friedrich Ebert Ring

Neuwied commercial area

2. Neuwied, commercial and industrial park next to the Rhine river. Image: Google Earth

Station Neuhäusel Wald

3. Station Neuhäusel forest. Image: Google Earth

Nitric oxide and ozone

We compare nitric oxide (= nitrogen monoxide) and ozone values in Koblenz and Neuwied. At the forest station Neuhäusel nitric oxide is not detectable, because it can be found only close to the sources and is afterwards oxidised in the air.
In particular in the morning nitric oxide increases with the emerging traffic (Koblenz). But as soon as the amount of ozone formed increases as well, it disappears again.
 

NO O3 Koblenz

4. a + b NO and O3 concentrations in Koblenz and Neuwied.

NO O3 Neuwied

Source: All graphs are taken from the website of the air measurement network Rheinland-Pfalz

Nitrogen dioxide and ozone

We compare nitrogen dioxide and ozone at the three stations.
 

NO2 O3 Koblenz

5. a - c) NO2 and O3 measurements in Koblenz ...

NO2 O3 Neuwied

... Neuwied ...

NO2 O3 Neuhäusel

... and Neuhäusel.

wind temperature Neuwied

6. Wind direction and temperature curves are shown for Neuwied. The second day is warmer.

Nitrogen dioxide concentrations are higher in the towns. But for ozone this is not the case. Ozone formation and depletion depends on several factors. They can favour formation in the countryside and depletion in the city. Ozone is also transported with the wind.

Direct comparison of the stations

We compare nitrogen dioxide and ozone for the three stations in one graph:
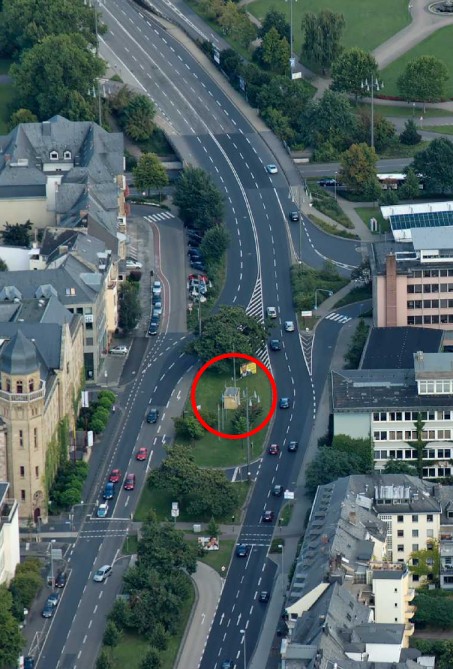
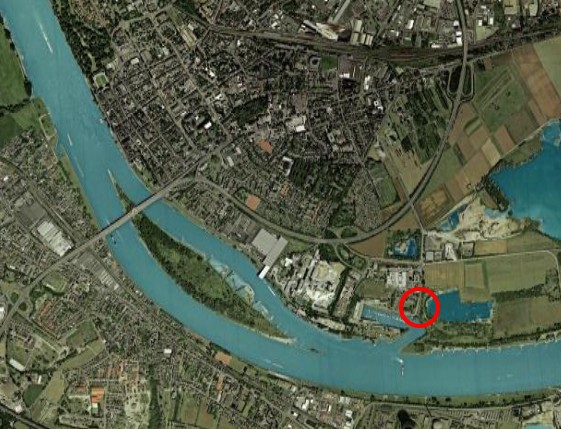
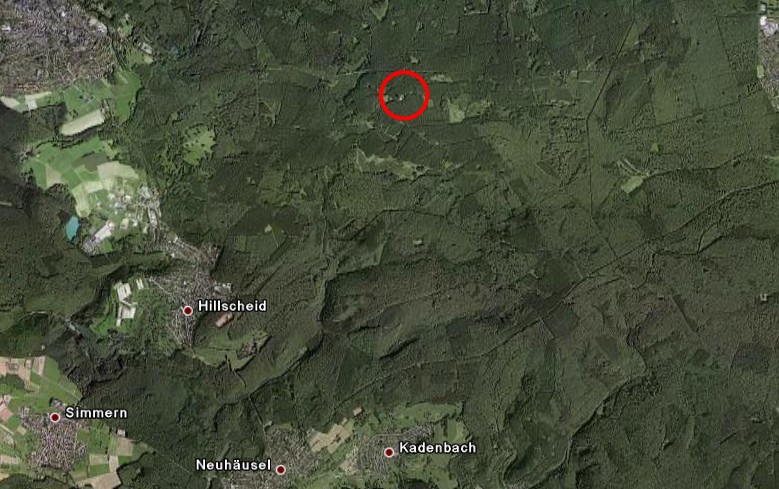
Koblenz = blue, Neuwied = red, Neuhäusel = green
 

NO2 comparison

7. NO2 comparison of all stations.

ozone comparison

8. O3 comparisons of all stations.

Comparison NO

9. NO comparison of Koblenz and Neuwied.

We can see that ozone is clearly going down in the city and next to the town of Neuwied during the night. This is not the case at the station in the forest. Therefore we can conclude, that ozone is more subject to depleting reactions in cities and in the urban environment.
 

We can see that NO levels are higher in the city (Koblenz) than around the city (Neuwied).
 

 top

ACCENT / ESPERE

last updated 14.12.2007 | © ACCENT - Atmospheric Composition Change 2013