espere ACCENT online magazine
Printer friendly version of this page
Home    ACCENT Educ.    Science    Encyclopaedia    es    ru    fr    de    it    cn   
Climate Change classes 1
UQ 3 May 07 Cars and ozone
R: Ozone trends
R: More NO2 in cities
F: Particle filters
A: Traffic & immission analysis
A: Example - Ozone and NOx
A: Questions
UQ 2 Mar 07 Urban air
Climate change 2007 IPCC special
UQ 1 Nov Dec 06 Particles in air
Special: Oct. 2006 Communication
Nr 10 Sept. 2006 Africa's emissions
Nr 9 July 06 Air traffic
Special: June 06 Climate summit
Nr 8 April 2006 Ozone & N2 cycle
Nr 7 March 2006 Climate modeling
Nr 6 Feb. 2006 acid rain
Nr 5 Jan. 2006 oceanic sulfur
Special: Nov 05 Ozzy Ozone
Nr 4 Oct. 2005 light/satellites
Special: Sept 05 Cyclones
Nr 3 Sept. 2005 methane/energy
Special: July 05 Greenhouse Earth
Nr 2 June 2005 forest/aerosols
No 1 May 2005 vegetation/CO2
     
Activities

Activities: Traffic, nitrogen oxide and ozone analysis in your town

Investigate how much traffic is observable in your town and if you find links to the concentrations of nitrogen oxides and ozone. How do they change during the day?


Background:

There are links between the traffic in the streets, the local weather situation and the concentrations of nitrogen oxides (NO, NO2) and ozone in the towns and the suburbs of the town. If your school is close to a station of the local air quality network, we encourage you to investigate the traffic intensity and the concentration of air pollutants in the streets near to your school.

Material and conditions:

Ideal conditions would be if the school had one or even more mobile ozone detectors available.
 

Since this is usually not the case, please check if there is a measurement point of the local air quality network installed. Such points often look like a small metal building or box on the street as for construction working and have some instruments on top. (see image)

Their location can often be found out checking the website of the local air quality monitoring maintained by the local, regional or state administration. Please check also if the data automatically generated in this station can be accessed online on the Internet. Alternatively, please ask the local officers of the air quality monitoring for assistance and data.
 

air quality station

1. Air monitoring station. Source: Land Schleswig-Holstein

If you are used to working in geography with geographic information systems (GIS), you may develop a small map of the traffic intensity for different times of the day and use this in a GIS software.
An example of free GIS software is SAGA GIS: www.saga-gis.org

For this you need geo-referenced maps from your region. If you do not have access to them, you may work for example with Google Earth.

If a “field experiment” is not possible during the classes, you may also work with data from stations in your region and analyse them in the classroom as shown in the example below.
 

Objective:
 
Investigate if and how the local ozone production is related to the traffic near to the station or in the region of the station. If an ozone detector is available in your school, you can measure ozone yourself.
It is recommended to choose a sunny day in spring, summer or early autumn.
 

highway traffic

2. Traffic counting from a bridge over the highway. Photo: Elmar Uherek

Task:
 

Measure the traffic intensity in a street or several streets next to one or two ozone measurements points. For this purpose, count cars over a well-defined time period at different times of the day. Compare with ozone values.
 

What has to be considered?

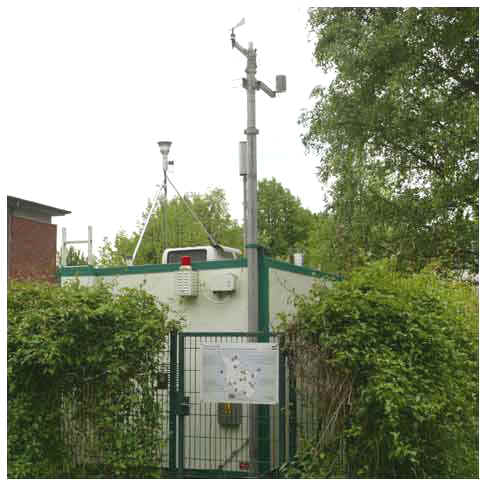
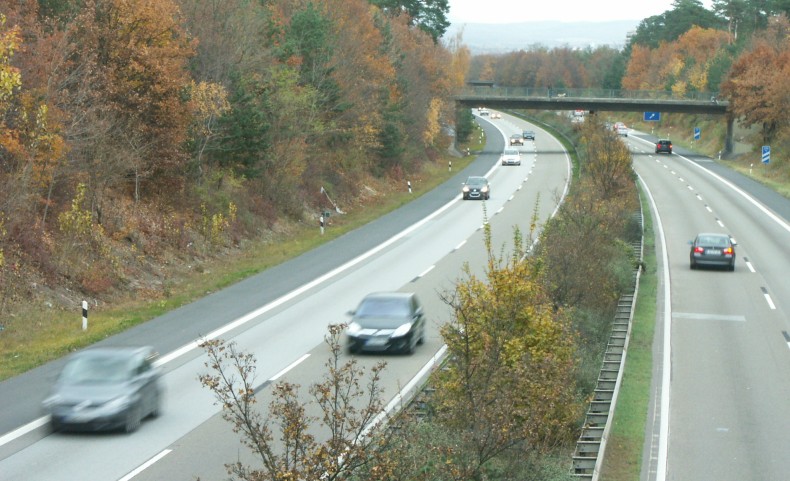
If the measurement point for ozone is next to a busy street it is likely that local ozone is depleted by the NO emissions from traffic. Such stations are suitable for the parallel analysis of nitrogen oxide data and comparison of data from traffic counting.

If the measurement point for ozone is in a housing area or a suburb it is likely that the role of local traffic is minor. If you choose places for traffic counting, consider major streets in the vicinity, but do not expect a strong dependence.

Please consider the wind direction. Choose places for the traffic counting which are located in a way that the wind blows from the street where you count cars to the measurement point.
 

 top

ACCENT / ESPERE

last updated 07.12.2007 | © ACCENT - Atmospheric Composition Change 2013