|
|
 |
|
|
|
|
|
|
|
|
Background ozone and long distance transport of nitrogen oxides
Although many measures for improvement of the air quality have been taken in the past, nitrogen oxides are still a problem in the air around us. With this comes the problem of ozone in the atmosphere at ground level. The main reasons are nitrogen monoxide and nitrogen dioxide in urbanised areas. But independent from the decreasing number of ozone smog events in Europe the background concentration of ozone is increasing.
|
 |
|
|
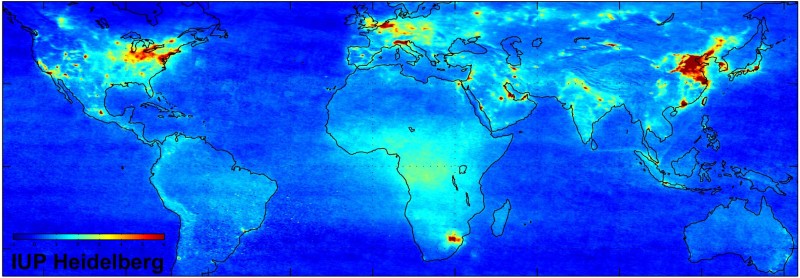
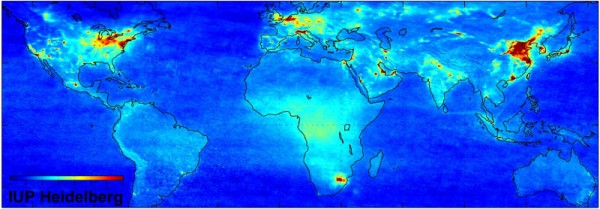
1. Map of the average nitrogen dioxide burden in air. (Source: IUP Heidelberg, ESA, 2004). Human activities cause a lot of NO2 emissions, mainly from power plants, heavy industries and traffic. Furthermore the gas is emitted during biomass burning. But there are also natural sources like lightning or bacteria in soils.
Please click to enlarge. (90 K)
|
 How to measure background ozone? How to measure background ozone?
To determine concentrations of background ozone it is important to select air masses that are largely unaffected by local or regional influences. This can be done either by looking for elevated concentrations of indicator pollutants such as carbon monoxide or by using a computer simulation to calculate where an air mass has originated. If the air contains high concentrations of pollutants or has passed over a populated area then it is not classed as background. One such station where background ozone is measured is Mace Head, on the west coast of Ireland (see ACCENT magazine Nr. 2 - Research).
|
|
 |
|
|
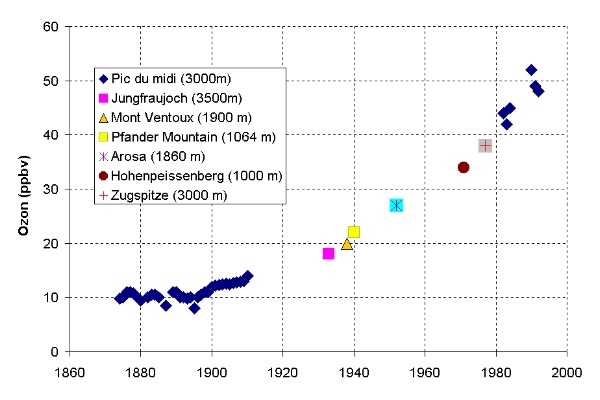
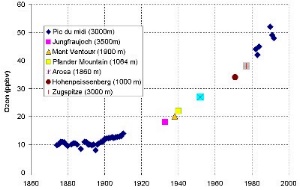
2. Tropospheric ozone levels have continuously increased since the first measurements were made in 1870. The diagram shows the fraction of ozone in every billion volume fraction of air = ppbv. Composed by Valérie Gros, MPI Mainz, adapted from: Marenco et al., 1992 (Long term evolution of ozone at the mid-latitudes of the Northern Hemisphere, European Geophysical Society, XVII General Assembly, 6-10 April 1992, Edinburgh).
Please click to enlarge. (60 K)
|
|
|
What is background ozone?
Close to the cities, the ozone concentrations shows in particular on warm summer days a typical pattern of maxima and minima.
|
They depend on the maxima of nitrogen oxide emissions from traffic. This pattern becomes less pronounced if we observe ozone at more remote places as shown for Zugspitze (mountain peak, white), Schauinsland (hill top, green) or Westerland (North sea island, light blue) compared to Frankfurt (red). At less urbanised locations the ozone levels are closer to background levels which are continuously in the air independent of the location.
|
|
 |
|
|
3. Average daily pattern of measurement stations of the German Agency for the Environment at Zugspitze, Schauinsland, Westerland und Frankfurt/Main between 1995 and 2001. Source: Umweltbundesamt Germany
Please click to enlarge. (25 K)
|
|
 |
|
|
4. BAE146 atmospheric research aircraft, for more details please go to the Facility for Airborne Atmospheric Measurements home page, http://www.faam.ac.uk/ A number of ACCENT partners were involved in the ITOP program.
|
|
|
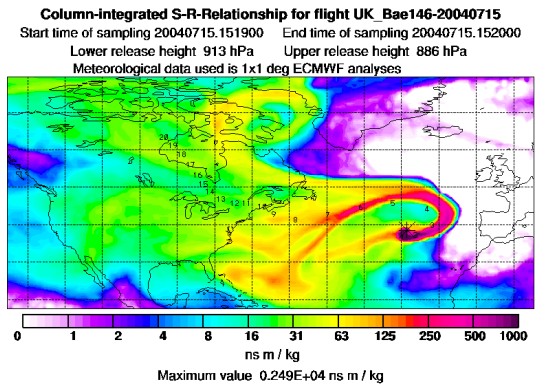
Observations from long distance transport
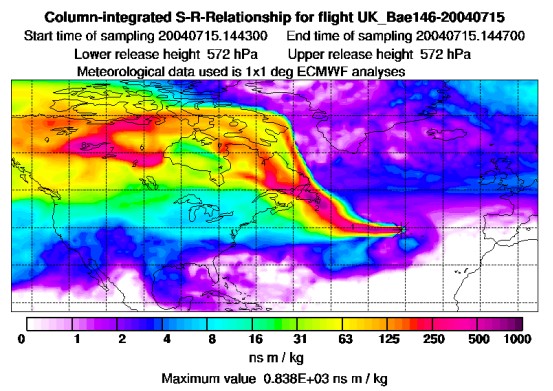
It has become increasingly apparent that transport of pollution around the globe has a big impact on background ozone concentrations in Europe and elsewhere. To investigate the transport of ozone and the ingredients that make ozone, a specially equipped British research plane made a number of flights over the Atlantic in the summer of 2004 (the ITOP - Intercontinental Transport of Ozone and Precursors - campaign).
|
During the ITOP experiment among other things CO, ozone, and peroxy radicals (HO2 + RO2) were measured. A number of polluted air masses were encountered where concentrations of all three mentioned species were higher in the plume than outside of it (see figures). The fact that levels of peroxy radicals are higher in the polluted air tell us that it is photochemically active. This is just one example of intercontinental transport of not just ozone but air masses that are making ozone and bringing the ingredients to make ozone across long distances and enhancing background ozone.
|
|
 |
|
|
5. Flight measurement data: Before 15:00 concentrations of peroxy radicals, ozone and carbon monoxide are all higher than from 15:10 onwards. In the first period the plane is passing through a plume of pollution from the Alaskan forest fires of summer 2004.
Figure from Alex Parker, University of Leicester, ACCENT partner
|
|
|
Conclusions about long distance transport
Although reductions in emissions have been effective in reducing peak level ozone, European background ozone levels are influenced by transport of ozone and ozone precursors from other continents. The pollution that is emitted on one side of the globe can affect the air quality on the other.
|
 |
|
|
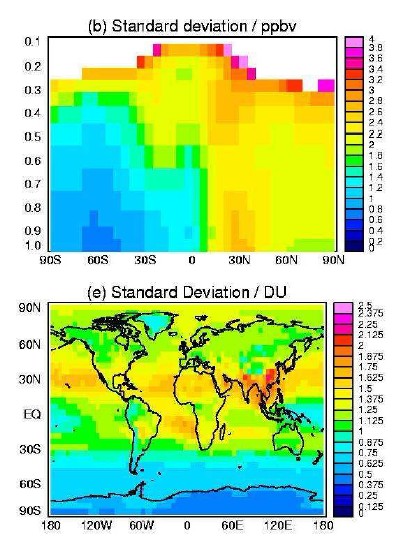
8. Mean change in annual mean tropospheric ozone burden versus change in global NOx emissions for three different model scenarios.
|
|
|
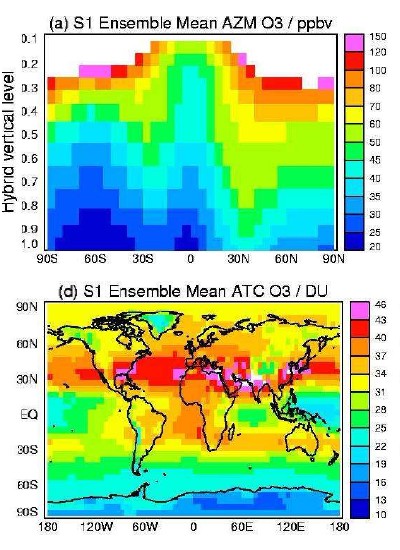
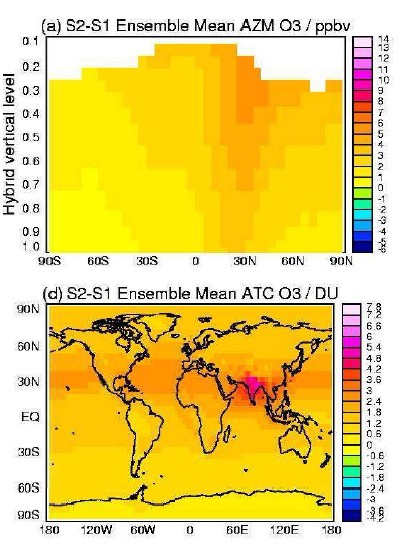
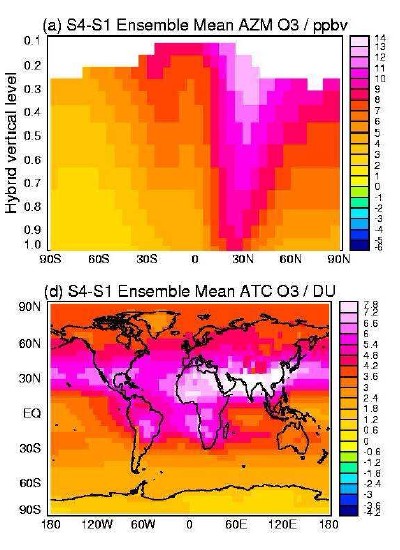
Outlook to the future
Ozone concentrations depend on nitrogen oxide emissions as shown in the graph on the left but not only on the emissions in our region as we have seen. Therefore we are interested in how the global emissions and the levels for background ozone are going to develop.
In order to answer this question ACCENT coordinated a joint study modeling the ozone trends up to 2030 in 25 different computer models.
|
|
The results range in a global average from 5% decrease to 6% increase or even 15% increase. This is a wide uncertainty range. But it becomes understandable because apart from the unknowns about future human emissions also the impacts of climate change play a major role for our atmosphere. Assuming that the average temperature of the Earth will be 0.7°C higher in 2030 the dynamics and the conversion rates in the chemistry of the atmosphere can change.
For example, nitrogen oxide emissions from lightning (the most important natural source) during tropical and subtropical thunderstorms are hard to estimate, since the convection changes. Also the plants could become more active in a warmer world, release more organic compounds like isoprene and change the budget of organic nitrogen oxides.
The following maps show model results.
Please click on them to make them larger. (60 - 80 K)
|
|
Summary:
Europe can be affected by an increase of background ozone because of an increase in nitrogen oxide emissions caused by human activities and global warming in other regions in the world. This would be in the range of a few parts per billion and be less critical for our health than peak values on ozone smog days, which can be around 100 ppb near to the ground. However, the worldwide increase causes an additional and relevant greenhouse effect, since ozone is a much stronger greenhouse gas than carbon dioxide.
|
Authors:
Mark Jacob - Technical University of Freiberg
Elmar Uherek - Max Planck Institute for Chemistry, Mainz
References
Information for the transport part is coming from:
Simmonds et al, Significant growth of background ozone at Mace Head, Ireland, 1987 – 2003, Atmospheric Environment 2004 (Author from ACCENT associate, University of Bristol)
Parker et al, Peroxy Radicals and Ozone Photochemistry in Air Masses Undergoing Long-Range Transport, manuscript in preparation
Graphics in the outlook chapter are taken from:
Stevenson, D. S., et al. (2006), Multimodel ensemble simulations of present-day and near-future tropospheric ozone, J. Geophys. Res.
|
|
|
|