|
|
 |
|
|
|
|
|
|
|
|
Natural gas
Are pipeline leaks warming our planet?
|
 |
|
|
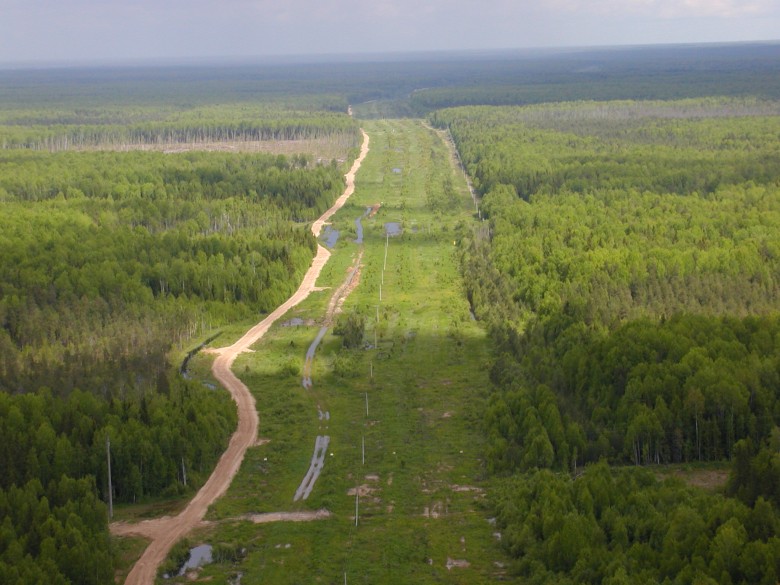
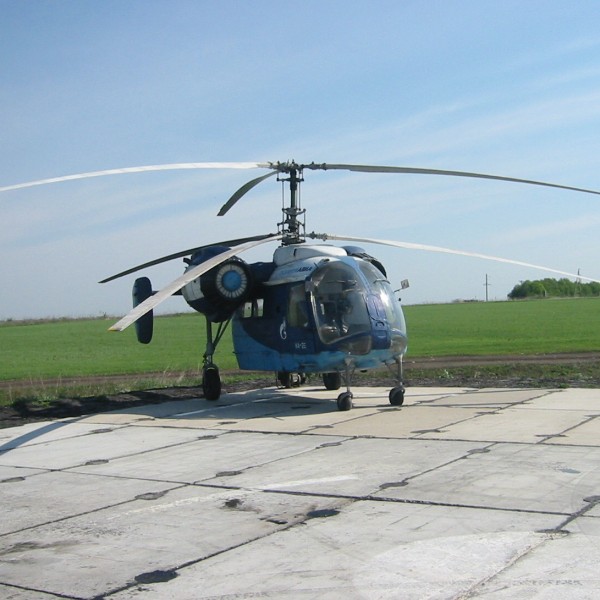
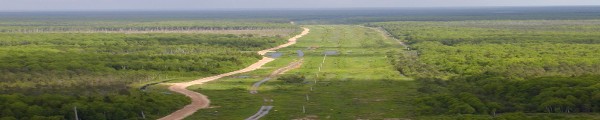
1. Route of the pipeline as seen from helicopter. The pipeline itself is 1.5 m under the ground © LA
Click the photo for a full size view! (120 K)
|
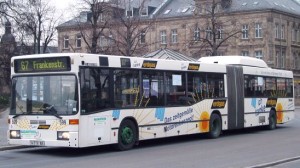
Natural gas is often advertised as clean energy, for example in gas powered buses. In fact the efficiency in burning natural gas is higher than for other fossil fuels and the greenhouse gas emissions per energy content (about 56 t CO2 per Tera-Joule) are lower than for oil, lignite or hard coal. However, natural gas is usually about 97% methane and methane is 23 times as strong a greenhouse gas than carbon dioxide. How much methane escapes into the air before the natural gas is burnt in our power plants and households?
|
|
 |
|
|
1. Natural gas driven buses are regarded as a climate friendly alternative.
© Local Transport Franken / Nürnberg (Germany)
Please click the photo for a larger view! (70 K)
|
|
 |
|
|
2. Direct CO2 emissions of different fossil fuels per energy content
© Wuppertal Institute
Please click the graph for a larger view! (13 KB)
|
|
|
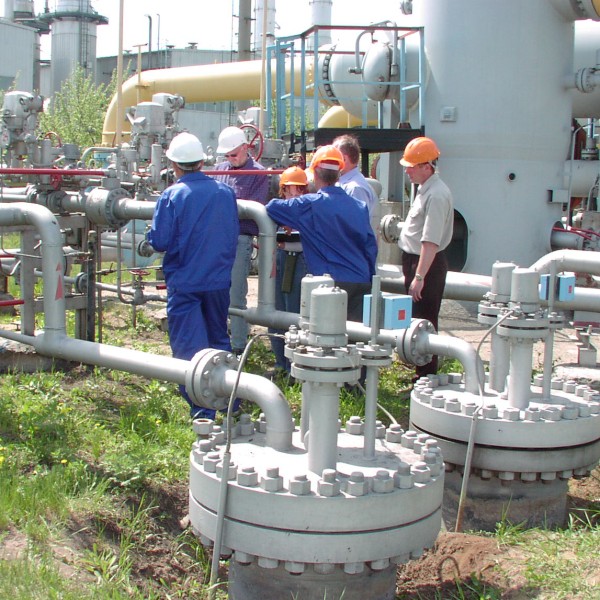
A team from the Russian natural gas provider Gasprom, the German provider E.ON Ruhrgas, the Wuppertal-Institute for Climate, Environment and Energy and the ACCENT partner Max-Planck-Institute for Chemistry Mainz investigated pipelines in Russia.
 Indirect emissions - transport and leakage Indirect emissions - transport and leakage
From our cars, planes or when we are carrying heavy bags, we know: Transport requires energy. This is not only valid for the transport of goods, but also for the transport of energy resources themselves.
|
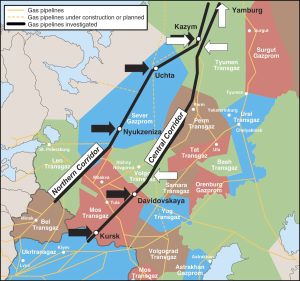
A large percentage of our natural gas supply comes from the gas fields in the north-west of Siberia, about 4000 km away from western Europe.
In order to pump the gas through pipelines to western Europe, it is transported with a pressure of about 75 bar. Every 100 - 150 km a compressor station is installed, where the gas is compressed and cooled in order to keep this pressure. The compressors burn a small fraction of the natural gas and release carbon dioxide.
|
|
 |
|
|
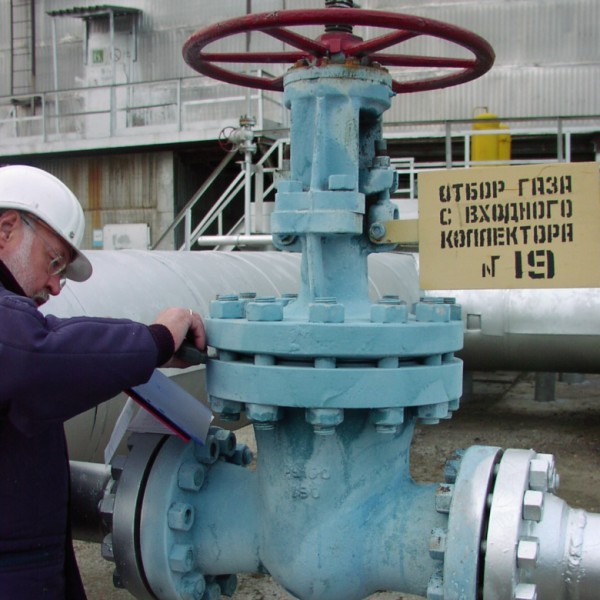
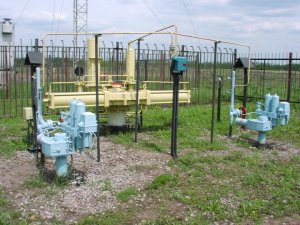
3. Valve node of the pipeline, which is under ground - near Kursk © LA
Click the photo for a larger view! (180 K)
|
|
 |
|
|
4. The stations marked with black arrows were the points of the campaign in 2003, the white arrows mark measurement points in a campaign of 1997.
Please click the map for a larger view! (90 KB)
|
|
|
The compressor stations include thousands of flanges, valves and connections so that there is a high risk of leakage. A pipeline consists of 3 to 5 pipes installed in parallel, with gate valves (called valve nodes) located every 30 km. Leakages may happen at valve nodes and the pipes have corroded. If the latter is the case, the escaping gas is self-ignited. Besides these, there are also planned and technological emissions:
There are emissions from compressor drive engines and/or electrical power plants. Some emissions relate to pneumatically driven valves releasing some CH4 in the atmosphere upon their operation.
|
Finally, to maintain and repair installation units, gas from these units (e.g from the entire compressor) has to be vented to the atmosphere.
All these processes release greenhouse gases, either CO2 or methane. To estimate the quantity of these emissions is important for energy policy and for emission trading in the Kyoto protocol process.
|
|
 |
|
|
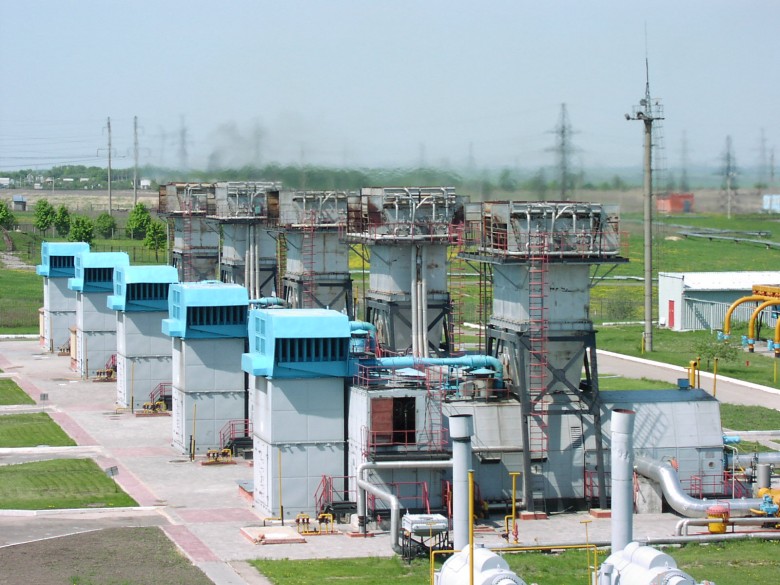
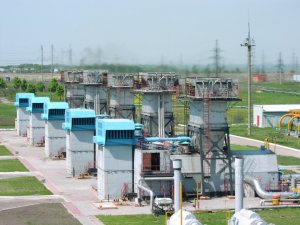
5. Compressors and turbines at the Kursk compressor station © LA (full size: 140 K)
|
|
 |
|
|
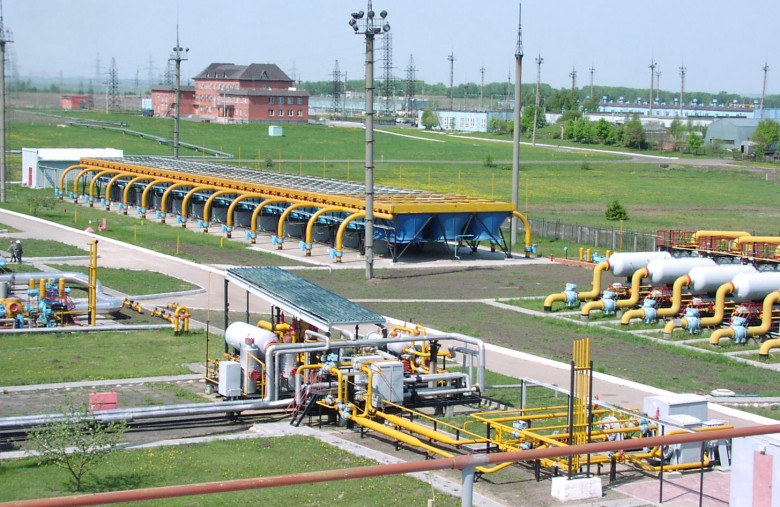
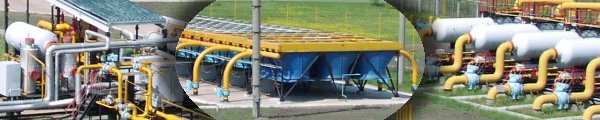
6. Gas coolers, gas driers and burning gas supply apparatus at the compressor station in Kursk. © LA
Click the collage for a full size photo! (140 K)
|
 |
|
|
7. Scheme of a compressor station
© Wuppertal Institute
|
|
|
Measuring emission - what has been done?
5 representative compressor stations with compressors of different type and different years of construction have been investigated. Numerous valves, flanges, connections, compressor buildings, filters, driers etc. which form a compressor station have first been scanned with leak detectors, leakages were marked and numbered. Second, the amount of gas coming out of a leak was measured by enclosing the leak with a sampling mantle which could be pumped out in order to determine the amount of methane released over a certain time. 2380 km of the pipeline (a single pipe equivalent) was checked by flying over it with a helicopter and a laser leak detector.
|
|
Results
First, the measurements enabled the emission rates due to leakages to be evaluated. Based on the measurement data and statistical distribution of compressor/valve/flanges age and type used by Gasprom, the emissions were extrapolated to the whole corridor, from gas fields in north-west Siberia to the eastern border of Germany.
Second, based on the operational statistics of Gasprom (number of compressors, their power and CO2 emission rates, number of repairs and volume of vented units), planned emissions were calculated. Since methane is by far a stronger greenhouse gas than carbon dioxide, the emissions can only be compared if the impact of methane is converted in an equivalent impact of CO2, so called t CO2 equivalents (1 tons of emitted methane is equivalent to 23 tons of emitted CO2 in a time scale of 100 years).
|
 |
|
|
13. Direct and indirect emissions of greenhouse gases from fossil fuel burning. Oil, hard coal and lignite are compared to three different studies for natural gas coming from Russia. The result of the study discussed here is on the right, marked in orange.
© Wuppertal Institute; Click the graph for a full view!
|
|
|
68% of the indirect emissions come from the CO2 released by the gas turbines of the compressor stations.
31% come from the release of methane (21% from leakages of flanges and armatures, around 5% from deflating during maintenance and repairing.)
In emission calculations the uncertainty of the data was also considered, which came from only 5 compressor stations and had to include average damage information from Gazprom reports. Results are shown in the maximum uncertainty bandwidth (95% certainty).
|
|
From these results it can be concluded that natural gas has a lower level of greenhouse gas emissions (direct + indirect) per energy content than other fossil fuels. For the gas from Russia it is 18% lower than for oil, 30% than for hard coal and 35% than for lignite. An additional advantage comes from the higher efficiency of the gas burning power plants.
Acknowledgements:
We say many thanks for photos, reviewing and scientific advice to Dr. Sergej Assonov (MPI Mainz) and for material and photos to colleagues from the Wuppertal-Institute for Climate, Environment and Energy. All photos marked with © LA are taken by S. Lechtenböhmer and S. Assonov.
Author: Dr. Elmar Uherek
Last update: 2005-06-06
|
|
|
|