|
|
 |
|
|
|
|
|
|
|
|
The variability of the solar constant
Drastic temperature changes in climate history
In the history of our planet Earth, there have always been changes leading to a global climate, which has significantly deviated from the present climate.
|
|
Such changes took usually millenia. We all know the alternation of glacial and interglacial times.
|
Fig 1: Temperature changes during the chronology of the glacial and interglacial times of the last 400,000 years. Figure adopted from Global Warming Art (Robert A. Rohde)
|
|
|
|
In some cases there have also been veritable climate shocks. The environment has experienced rapid changes over time spans of decades to centuries. During the so-called Dansgaard-Oeschger events the average temperature in Greenland increased by 8-16°C within a few decades.
|
 |
|
|
Fig 2: Sequence of Dansgaard Oeschger events during 40,000 years in the last ice age. The fraction of 18O isotopes, which varies in precipitation depending on the temperature, can be used as an indicator for the temperature.
|
|
Such events usually mark the end of an intermediate glacial. A long continuous cooling is followed by a rapid warming at the end of this period. Most recently such a sudden warming occurred about 11,600 years ago at the end of the last ice age.
Such dramatic regional changes are estimated to be a consequence of changes in the ocean circulation. The present rapid warming, however, of about 0.7°C within the last 100 years, takes place globally and is not related to an ice age.
|
Temperature changes during the last 1000 years
For more than 11,000 years we have been experiencing a relatively stable interglacial (warm period), the so-called "holocene". But also in this time, which coincides with the development of modern mankind, the average temperature in the world has undergone changes. During the so-called "little ice age" with a temperature minimum in the period 1645 to 1715, it was regionally up to 1°C colder than in the warmer period from 800 to 900. In this warmer time, the vikings settled in Greenland.
|
|
 |
|
|
Fig 3: viking boat, Photo: Marcin Dmoch
|
|
|
|
|
Sun spots and the Schwabe cycle
Such changes are seen to be related to variations in the intensity of the solar radiation. The solar constant is not really absolutely constant. It changes within different solar cycles. The best observed is the so-called "Schwabe cycle".
4. Fig left: The 11-years Schwabe cycle. Source: USGS |
The amount of sun spots increases with a periodicity of 11 years. In parallel, the radiation of the Sun becomes stronger. This cycle alone, which has a minimum in early 2008, leads to a variance of the solar constant by 0.1%. The resulting temperature change, if not influenced by other factors, would be in the range of 0.5 to 1°C.
|
|
 |
|
|
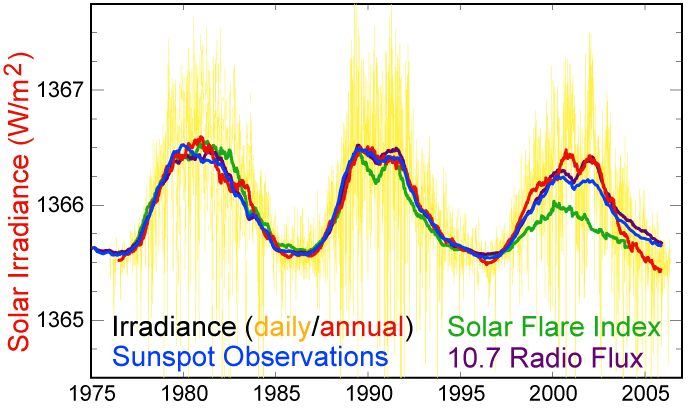
5. Variation of the absolute value of the solar constant during the last decades. Graph: Robert A. Rode for Global Warming Art.
|
|
|
|
|
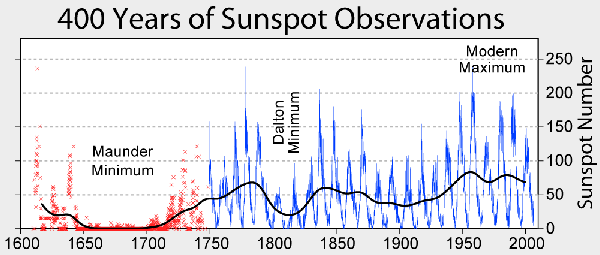
However, this cycle cannot explain today's long-term climate trends. The number of sun spots was very low in the period 1645 to 1715. We call it the Maunder Minimum. The value of the solar constant decreased by about 0.2%.
Fig 7 on the left: Sun spots of unusual size. It seems contradictory, that the solar activity increases because of the dark sun spots. But around these spots the radiative intensity is higher than normal. Source: SOHO project / NASA |
|
Such minima occur over longer time intervals, which are most likely a consequence of long term solar cycles superimposing the Schwabe cycle. Scientists know a roughly 200-year overlaying cycle (Suess cycle) and a roughly 88-year cycle (Gleissberg cycle). At present, we are in the period of a mid-term maximum.
|
 |
|
|
Fig 8: Observation or estimation of the number of sun spots during the last 400 years. Graph: Robert A. Rohde for Global Warming Art.
|
The climate impact of the Sun.
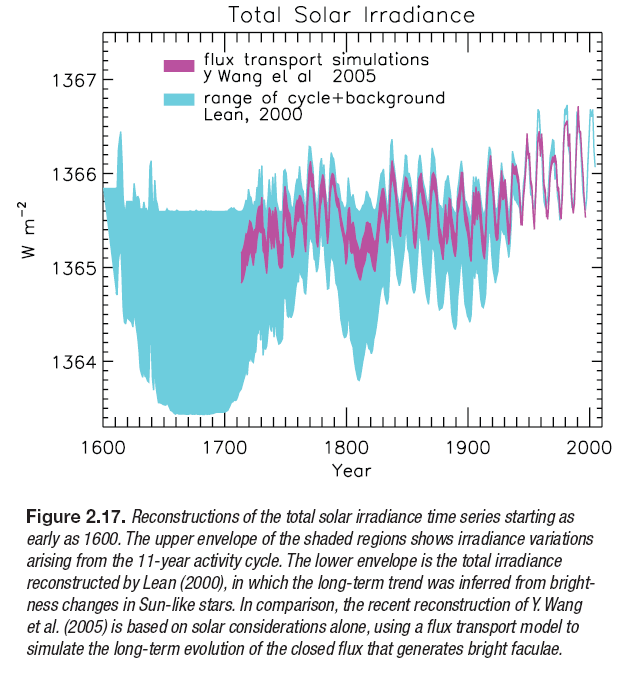
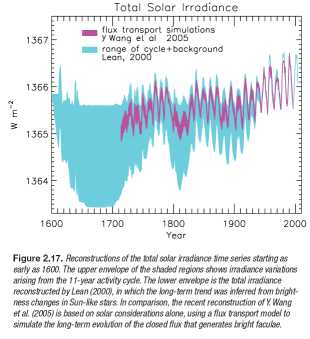
In climate science, we define the radiative forcing as a measure for how much and in which direction a climate factor contributes to climate change. Former estimations assumed that the increase of the solar activity from the Maunder Minimum to today's minima compares to a radiative forcing of 0.38-0.68 W/m2. These estimations are based on observed activities of stars which are similar to our Sun (in light blue in the graph on the right). Newer calculations (violett) carried out exclusively for the Sun now assume only a difference of 0.12 W/m2. (IPCC AR4, Graph with original figure caption on the right)
|
|
 |
|
|
Fig. 9: Solar irradiance from IPCC 2007, including the original figure caption.
|
|
|
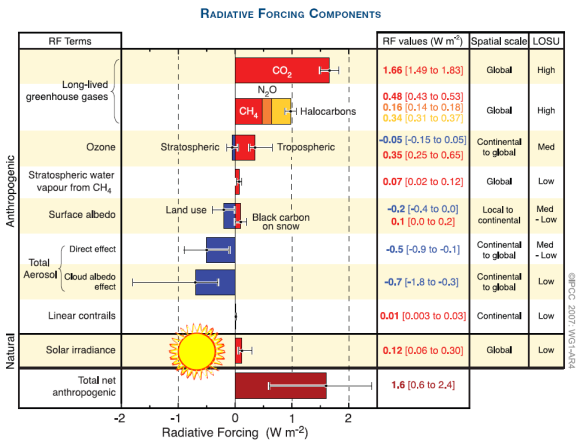
For comparison: The contribution of carbon dioxide to the Earth's warming of the last 100 years is about 1,66 W/m2. (see graph below).
|
 |
|
|
Fig 10: Contributions to the Earth's warming or cooling, measured as radiative forcing (power per square metre of the Earth's surface), Source: IPCC AR4 2007
|
Conclusion
Although the exact climate impact of the Sun is subject to a high uncertainty, two statements can be deduced from international research:
1) Changes in the solar intensity have contributed to the global warming of the last 100 years.
2) These contributions from the Sun are clearly smaller than the contribution due to greenhouse gases emitted as a result of human activities.
|
|
 |
|
|
Fig 11: The graph shows the development of the global average temperature and the solar activity based on sunspot numbers (see fig. 8) in one figure. Source: combined from Global Warming Art (Robert A. Rhode)
|
|
|
|
|