|
|
 |
|
|
|
|
| |
|
|
|
Higher Atmosphere
Basics |
Composition of the stratosphere
Most of the compounds released at the Earth surface do not reach the stratosphere. They are either decomposed by the main oxidants in the troposphere (OH, NO3, ozone), photolysed by sunlight, removed by dry or wet deposition or trapped in the cold tropopause. Because of the reversion in the temperature trend air exchange between the troposphere and the stratosphere is slow. The vertical exchange of the troposphere takes hours to days, the mixing of the stratosphere months to years.
|
|
|
|
|
|
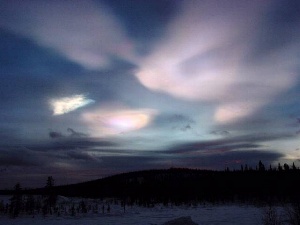
The first consequence is, that the water vapour content in the stratosphere is very low. Typical mixing ratios (definition see below) are in the range of 2-6 ppm (parts per million) compared to 1,000-40,000 ppm in the lower troposphere and 100 ppm in the upper troposphere. Therefore, formation of stratospheric clouds is seldom and requires very low temperatures for the formation of ice crystals. Such conditions are primarily given in the polar regions, where stratospheric ice clouds can be formed. The water vapour content of the stratosphere increases e.g. due to air traffic, the temperature decreases due to tropospheric warming. Therefore it cannot be excluded, that the formation of polar stratospheric clouds (PSC) becomes more likely.
|
|
 |
|
|
1. Polar stratospheric clouds over Kiruna / Sweden
source: MPI Heidelberg - full size: 35 K
|
|
Inorganic compounds in the stratosphere
Stratospheric chemistry is governed by ozone. 85-90% of the total ozone in the atmosphere is in the stratosphere. This trace gas is formed by photolysis of oxygen in the stratosphere itself. Photolysis means, that sunlight splits the oxygen bonds of the O2 molecule. Most other gases entering the stratosphere either come from the troposphere due to their long lifetime (e.g. nitrous oxide N2O, methane CH4, chlorofluorocarbons CFC, etc.) or are brought in by severe volcano eruptions (sulphur compounds, aerosols). Therefore inorganic compounds dominate the composition of the stratosphere: nitrogen oxides, nitric acid, sulphuric acid, ozone, halogens and halogen oxides from the destruction of CFCs.
|
 |
|
|
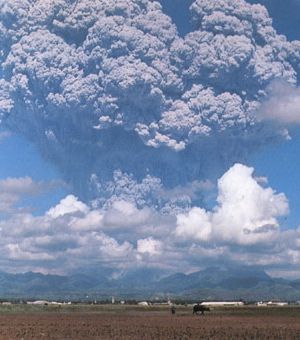
2. Eruption of Mt. Pinatubo Philippines in June 2001.
source: Cascades Volcano Observatory USGS Photo by Rick Hoblitt
|
|
|
Volcano eruptions
Severe volcano eruption can inject large quantities of gases and particles directly into the stratosphere. Such gases are halogen acids as HCl and HF or sulphur dioxide SO2, which is oxidised to sulphuric acid H2SO4 (one of the basic compound for cloud formation). The particles (mostly inorganic material as silicates, halide salts and sulphates) can absorb sunlight already in the stratosphere and therefore lead to a temporary warming in the stratosphere and a cooling in the troposphere. Such effects may last about 1-2 years and can be measured over the whole hemisphere after eruptions. An example is Mt. Pinatubo, which erupted in June 1991.
|
Understanding concentrations and mixing ratios
We can express the amount of a compound in the atmosphere in two ways, relative and absolute:
a) mixing ratio = the fraction of this compound of all air molecules. If there are 40 ozone molecules in 1 Mio. air molecules the mixing ratio is 40 ppm (parts per million). This is relative.
b) concentration = the mass of the molecules of this compound in a certain volume of air. If there are 100 µg of ozone in one cubic meter of air, the concentration is 100 µg / m3. This is absolute.
With the aid of the air pressure you can convert both values into each other.
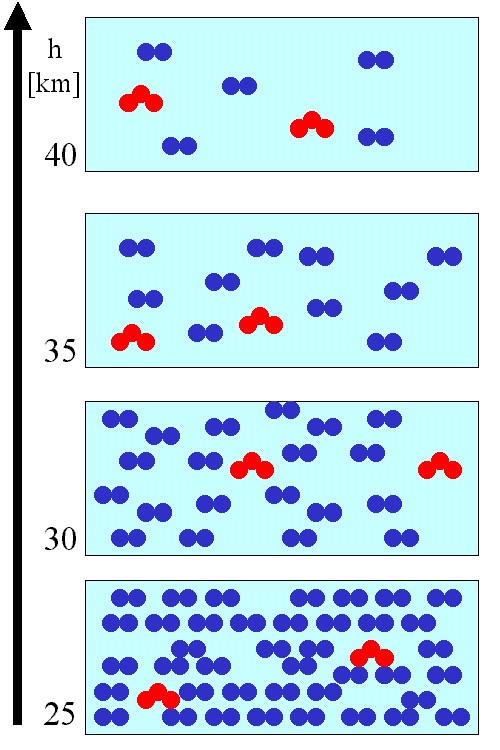
Pressure decreases with altitude, i.e. the higher we go in the stratosphere, the less molecules we find per cubic meter of air. This means: If the absolute mass of ozone remains the same with the altitude, the relative fraction of the total increases.
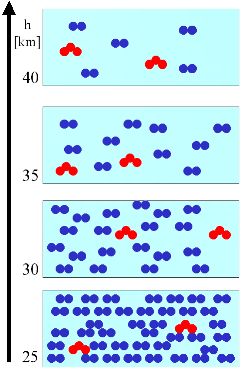
We explain this general principle in a very simple example. In a certain volume of air (light blue box) there is a certain number of air molecules (blue) and a certain number of ozone molecules (red). The number of air molecules decreases always with the altitude. |
 |
|
|
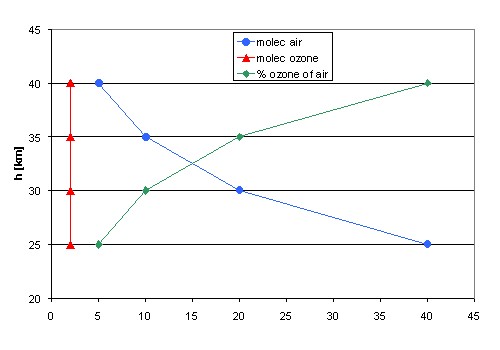
3. (L1) On the left we assume, that the amount of ozone molecules [concentration = molecules/volume = mass/volume, unit e.g. molec./m3, hPa, µg/m3] remains constant with the altitude (red triangles in the profile). Relative to the air molecules (blue circles) the mixing ratio [green diamonds, unit e.g. %, ppm = µmol/mol, ppb = nmol/mol, ppt = pmol/mol] of the ozone increases (see below).
|
|
|
 |
|
|
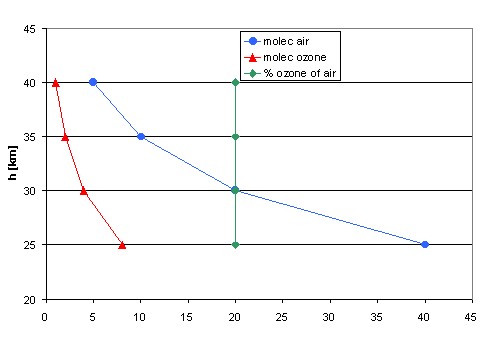
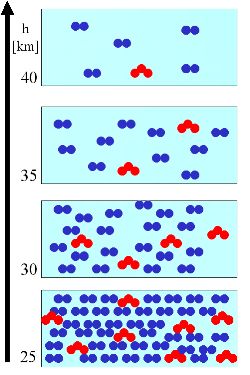
3. (R1) On the right we assume, that the amount of ozone molecules decreases in parallel with the amount of air molecules. The mixing ratio (molecules ozone per molecules of air) remains constant over the altitude (green diamonds): 8/40, 4/20, 2/10, 1/5 = 20%. But the absolute number of ozone molecules per volume air (red triangles) decreases.
|
|
|
What is the reality? The right example is only realistic on top of the maximum of the ozone layer. From the ground to the lower stratosphere the left example is a good description. The concentrations remain nearly the same, but since the surrounding air becomes thinner, the mixing ratio increases. In the lower stratosphere even the concentration increases (the example below shows an increase by a factor of eight).
|
|
|
|
In publications you may either see the red or the green profile of ozone in the stratosphere or even both. But do not forget, that ozone is not 1 of 5 molecules in the air, but more likely 1 of 1 million [1 ppm].
4. Fig. on the left: ozone profile, both, concentration and mixing ratio are shown
source: adopted from IUP Bremen
|
About this page:
author: Dr. Elmar Uherek, Max Planck Insitute for Chemistry, Mainz
scientific reviewer: Dr. John Crowley, Max Planck Institute for Chemistry, Mainz - 2004-05-04
educational proofreading: Michael Seesing - Univ. of Duisburg, Dr. Ellen K. Henriksen - Univ. of Oslo, Yvonne Schleicher - Univ. of Erlangen-Nürnberg
last published: 2004-05-05
|
|
|
|