espere ACCENT online magazine
Printer friendly version of this page
Home    ACCENT Educ.    Science    Encyclopaedia    es    ru    fr    de    it    cn   
Climate Change classes 1
UQ 3 May 07 Cars and ozone
UQ 2 Mar 07 Urban air
Climate change 2007 IPCC special
UQ 1 Nov Dec 06 Particles in air
Special: Oct. 2006 Communication
Nr 10 Sept. 2006 Africa's emissions
Nr 9 July 06 Air traffic
Special: June 06 Climate summit
Nr 8 April 2006 Ozone & N2 cycle
Nr 7 March 2006 Climate modeling
R: Global climate estimation
C: How climate models work
C: Simple models
A: Activities
How did the Earth develop?
How will the climate develop?
What can we do?
L: Links
I: Information for teachers
Nr 6 Feb. 2006 acid rain
Nr 5 Jan. 2006 oceanic sulfur
Special: Nov 05 Ozzy Ozone
Nr 4 Oct. 2005 light/satellites
Special: Sept 05 Cyclones
Nr 3 Sept. 2005 methane/energy
Special: July 05 Greenhouse Earth
Nr 2 June 2005 forest/aerosols
No 1 May 2005 vegetation/CO2
     
Activities

Explore a climate model

1) How has our planet Earth developed so far?

Test the interactive climate model and answer! Click on the illustrations of this page and enlarge them. It will help you to find the right settings for the model.


How did our planet Earth develop?

How did the CO2 emissions develop in the past and how might the trend go on in the future. Look at the overview by region.


CO2 distribution

Consider that the grey shape of the future development is not "fixed" but depends on the “scenario” you choose. In the case shown, CO2 stabilised at 500 ppm in 2100. Before you change this rather optimistic scenario, please see first how the world has developed so far and the consequences.


CO2 sources sinks

Choose the % view of the emissions by region (red arrow). It tells you how much each region in the world contributed relatively (see the absolute growth in figure 1) to the total of all emissions (100%) in the world.

Task 1: Estimate the contributions of: USA, Europe (West + East), Asia, South and Middle America and Africa in 1940 and 2000. Estimate where the trend will go.

Choose the "Emissions Regions Map" (yellow arrow). It shows you in different projections (view = blue arrow) the regions contributing to the scheme on the left.
 

CO2 by region

Think over what you know about economy. The daily news tells you that all countries hope that it grows a few percent per year. An indicator of the monetary growth is the "gross domestic product" (GDP). See how it developed in the last 30 years and what the model assumes for the future. See also the relative share between industrialised countries and developing countries (in particular in Asia). 

Task 2: Describe what you see. Which regions in the world have the highest GDP and which is the biggest population in the world. Where are the trends going?
 

GDP and population

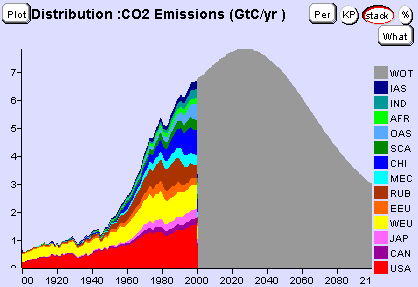
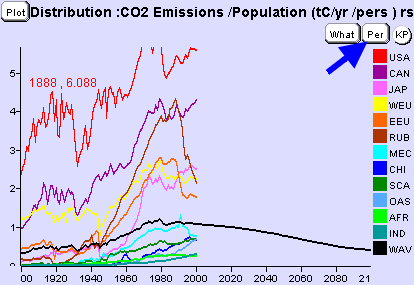
Make use of the "PER" button and choose CO2 emissions per population. It will give you information on how much CO2 in tons of carbon an average person in the respective region used up.

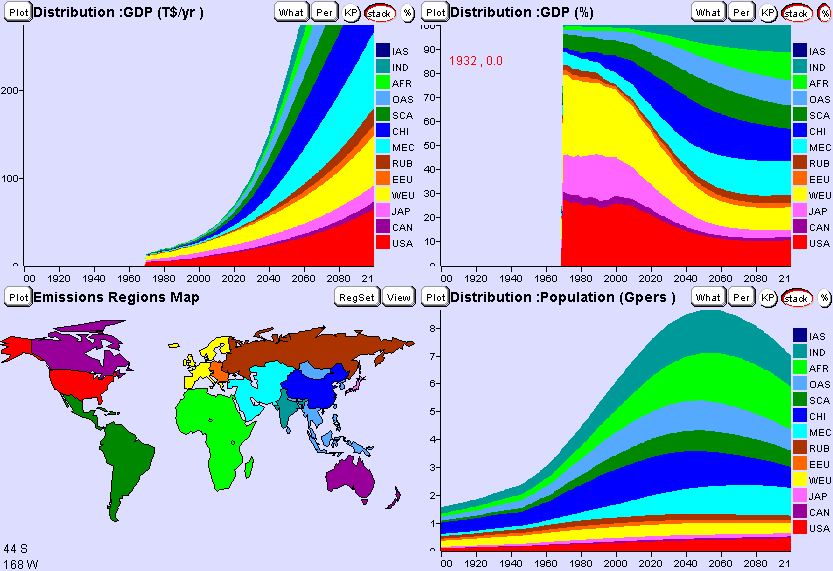
Task 3: Which factor had so far the stronger influence on CO2 emissions, GDP or population of a region?

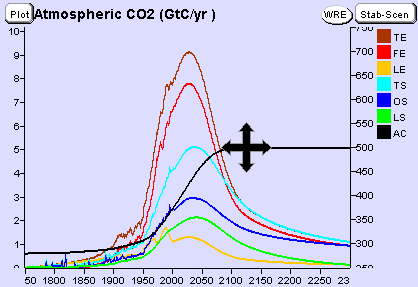
Press the "KP" button, which stands for the targets of the Kyoto protocol.

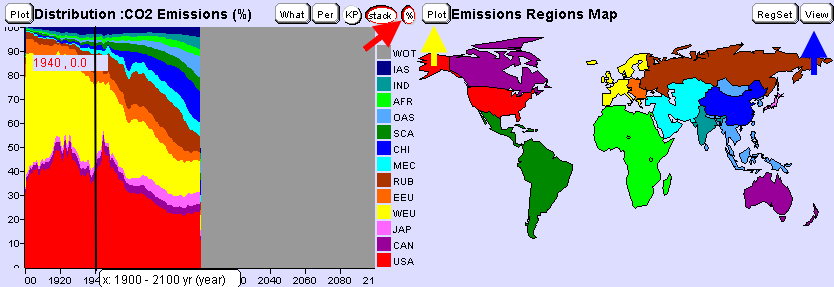
Task 4: Write a short answer of 3 sentences: What is the problem for the United States? Why was it easier to agree on the Kyoto protocol for Russia?
 

CO2 per capita


You see that there are not targets for the developing countries, because they were excluded from the protocol. You see that their emissions per person are low.

Task 5: Give a short statement (3 sentences): If you look out to the future economical development, do you think developing countries need to be involved in future protocols for emission control? Why?


 top

ACCENT / ESPERE

last updated 13.04.2006 | © ACCENT - Atmospheric Composition Change 2013