|
|
 |
|
|
|
|
|
|
|
|
The history of climate research and the IPCC
From the detection of the greenhouse effect to modern climate models
|
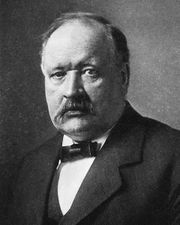
In 1895, the Swedish chemist and physicist Svante Arrhenius said: "The reduction or the increase of atmospheric carbon dioxide by about 40% may drive feedbacks, which are responsible for the progress or retreat of glacial times."
Image: Svante Arrhenius (public domain)
Already before 1900 scientists were aware of the effect of the greenhouse gas carbon dioxide, although its fraction in the air was only about one part in 280 million.
|
|
|
 |
|
|
Man and climate depend on each other. Graphic: Elmar Uherek
|
|
|
100 years later, modern research confirmed that indeed the carbon dioxide content of the atmosphere varies by about 40% between an ice-age (approx. 180 ppm) and an interglacial (approx. 280 ppm). Certainly we know nowadays that there are also other driving factors.
Nevertheless, compared to weather observation, climate research is a rather young field of science. Not before the 1950s did scientists seriously warn that the permanent release of carbon dioxide may lead to a change in the global climate.
|
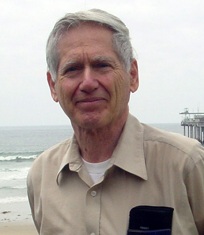
Consequently, it was also at this time, in 1958, that at Mauna Loa Observatory in Hawaii Charles David Keeling started a series of measurements which can now be regarded as one of the most important documentations of human activity: the exact measurement of carbon dioxide in the air. The Keeling curve is continued until today. Each year it shows the annual variation of carbon dioxide (among other factors due to uptake of CO2 in the growing season of plants and increased release during the heating period in winter). With the same accuracy it shows the continuous increase of the average over years and decades.
|
|
 |
|
|
Charles David Keeling. The scientist died June, 20th 2005. Photo: Scripps Institute of Oceanography
|
|
 |
|
|
The carbon dioxide curve from Mauna Loa observatory Hawaii. (GNU licence)
|
|
|
The graph begins after about 200 years of industrial activity at 320 ppm (parts per million), about 40 ppm higher than the typical value for an interglacial. During the 10,000 years of this interglacial (i.e. after the retreat of the glaciers from ice-age) CO2 varied by not more than 20 ppm. The graph shows an increase of about 60 ppm during the following nearly 50 years of the present industrial era up to 380 ppm. And this increase continues.
|
|
Also during the 1950s, first efforts were made to describe the circulation in the atmosphere in a numerical way and to simulate it. Progress has been enormous from that time to now thanks to the unbelievably rapid development in computer capacity.
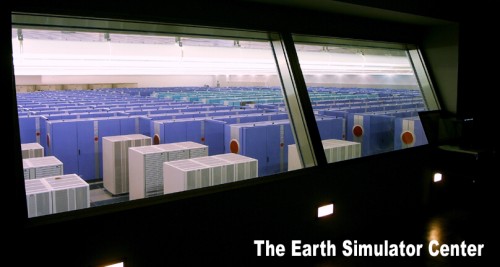
Today we have modern climate models which simulate the Earth's climate on giant computers with an acceptable (however still not yet sufficiently exact) accuracy. There is a dense network of weather observation stations and more and more advanced satellites, which deliver climate data from space.
|
 |
|
|
The Japanese Earth Simulator was in 2002 the faster computer in the world. The photo shows the computer hall. © JAMSTEC / Earth Simulator Center
|
|
 The history of weather observation The history of weather observation
Despite all modern technologies ... for us it is still (and perhaps more than before) necessary to make use of what the pioneers in weather observation achieved. The raising of awareness took place between 1950 and 1960 at a time when change was already in progress. And it took even much longer until the nations of the world began to tackle the problem together. Now we ask the questions: What was the situation before, when the climate was still less influenced by humans? Do we observe not only an increase in CO2, but also an increase in the global temperature?
|
Brief history of weather and climate science
- 1592 The first sort of thermometer was invented, based on the thermoscop of Galileo Galilei.
- 1653 The first meteorological network was formed (by 1900 systematic weather observations were made in nearly all inhabited areas of the world)
- 1853 organised international weather observation from ships commenced
- 1873 the International Meteorological Organisation (IMO) is formed
- 1873 Köppen composes the first meteorological database, relying on data from 100 stations for the time from 1820 to 1871. The majority of the data was reliable.
- 1923 IMO initiates the World Weather Record (WWR). The WWR project is continued until today.
- 1938 Callendar composes a world weather overview based on data from more than 200 stations.
- 1950 The World Meteorological Organisation (WMO) succeeds IMO.
|
|
 |
|
|
The Galilei thermometer. First temperature measurements were based on this technology.
|
|
- 1958 ... about 300 years after the first temperature measurements Keeling begins with a systematic CO2 monitoring.
- 1960, about this time a comparison of different independent weather databases becomes possible. The way towards the measurement of a global average temperature begins.
|
|
 |
|
|
Regional WMO conference
|
|
- 1980 The installation of a measurement network of buoys on the ocean begins (which is by now extended up to around 500). In parallel satellites deliver climate data from space.
- 1987 Hansen and Lebedeff (among others) suggest standards, in order to achieve a standardised averaging from weather stations.*
- 1988 WMO and the United Nations Environmental Program (UNEP) initialise the Intergovernmental Panel on Climate Change (IPCC). Its fourth assessment report (AR4) was released in 2007.
- 1992 The United Nations Framework Convention on Climate Change (UNFCCC) is established. In 1994 it came into force.
We see that weather monitoring has already been established for a long time, but the systematic data collection and estimation of global trends are very recent. Therefore the recent 6 years of climate monitoring since the third IPCC report are of some relevance for the confirmation of so far suggested trends.
|
|
 |
|
|
Key data of weather and climate science
|
|
|
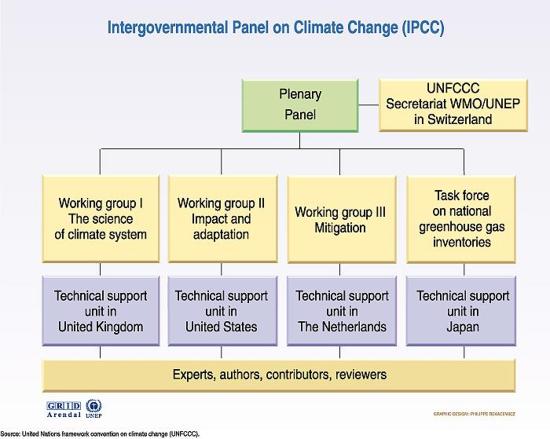
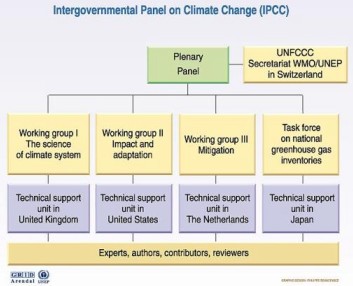
Mandate and structure of the IPCC
When the IPCC was introduced as a panel of climate experts and environmental scientists from nearly all nations on our planet it received the following mandate:
The role of the IPCC is to assess on a comprehensive, objective, open and transparent basis the scientific, technical and socio-economic information relevant to understanding the scientific basis of risk of human-induced climate change, its potential impacts and options for adaptation and mitigation.
|
The task was distributed to three working groups:
Workgroup 1:
Scientific aspects concerning the climate system and climate change
(What do we know about our climate?)
Workgroup 2:
Vulnerability and adaptation of the society, economy and nature to the consequences of climate change.
(To what extent are we endangered?)
Workgroup 3:
Options for a reduction of greenhouse gas emissions
(What can we do?)
|
|
 |
|
|
Structure of the IPCC, Source: UNFCCC
|
|
|
The climate of past geological eras
We now know that the Earth's surface is warming. We also know that the carbon dioxide level of the last 50-100 years has been running out of the range in which it was always stable during the development of human civilizations (Babylon, Egypt, Roman Empire). And we know that we have to react.
|
|
|
|
 | | Meanwhile, we also know that our reaction will be too slow and we are already running deeper into climate change. From this the question arises: how will the planet Earth will react to this? We need to know since we need to adapt.
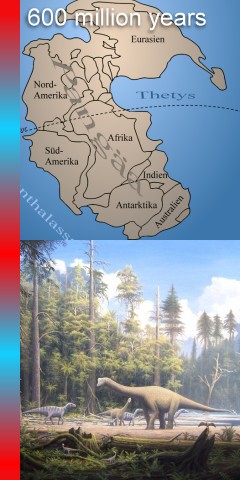
Basically, for mother Earth a warming of about 2-3°C on the surface is not a tragedy. Paleoclimatologists investigate the climate of the past, relying on sediment probing, ice cores and for the more recent times also tree rings. The Earth tells us that the climate was partially warmer and partially cooler than nowadays during the last 600 million years.
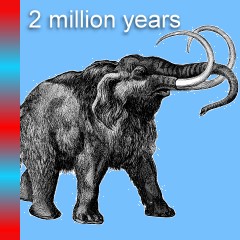
In this time species developed which were significantly different from those which populate the world now, for example the dinosaurs. Since there was only one continent, the distribution of heat in the ocean was much more homogeneous. Only when the former supercontinent (image on top) broke apart and began to drift to its present position, a climate began to develop which was closer to the present climate.
During the last 65 million years most of the time it has been clearly warmer than it is now, even with a moderate climate change included.
| 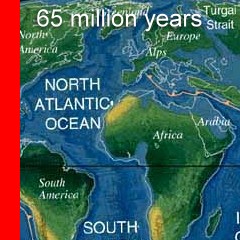 | | Also the sea level was a few metres higher. (On the left is a map of the globe in the eocene about 50 million years ago.) If we look at the past two million years, which is the time when human beings developed, we find an alternation of glacial times and interglacials.
The researcher Milankovitch explained this with his now confirmed theory, that the tilt of the Earth's axis varies in defined cycles of about 41,000 years between 22 and 24 degrees.
|  | | In parallel the distance between the Earth and the sun varies in cycles of 11,000 and 22,000 years and the Earth's orbit itself changes in cycles of 100,000 and 400,000 years from a clear ellipse close to a circle. From all these astronomical changes, the observable change of ice-ages and warm periods can be explained.
With the glacials and interglacials the carbon dioxide content in the air also changes (however in the past 800,000 years never as much as during the past 100 years as well as the salinity and fresh water intrusion from melting ice.
|  | | Owing to breaches in ice dams, severe changes often took place within a few years. Such changes in the ocean currents can lead to strong interactions and quick climate changes.
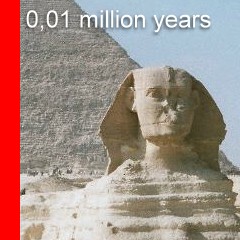
But for 10,000 years (0.01 million years) we have been living in a very stable interglacial. In this time the human high civilisations developed and clearly benefited from the stable conditions.
However, the world's climate already had some ups and downs on geological time scales, smaller ones also in the past 10,000 years. The planet has always come back to equilibrium.
|
|
But we need to be aware, that such extreme changes always cause the extinction of many species which are not able to adopt fast enough. This will happen to polar bears, corals and many other animals and plants. Also our species, human beings, with our biological roots, the numerous coastal towns, our agronomy, use of nature and our culture, we are strongly adapted to the stable climate conditions of the past 10,000 years.
|
|
*We need to consider that there are many more meteorological stations in the industrialised nations (Europe, USA) and that there are only few data from poorly inhabited regions (deserts, Siberia, polar regions, oceans). In order to give a global average temperature a weighting is necessary.
|
|
|
|