|
|
 |
|
|
|
|
|
|
|
|
Consequences of the warming
A summary based on the results published in the fourth IPCC report (AR4) on the state of our climate system.
Most of the consequences climate change will have for our planet are directly or indirectly related to global warming. The warming is mainly driven by greenhouse gases, in particular carbon dioxide. It is not only of interest how much carbon dioxide is emitted by humans, but also how much of this amount stays in the atmosphere.
|
|
 The feedback of climate change and the carbon cycle The feedback of climate change and the carbon cycle
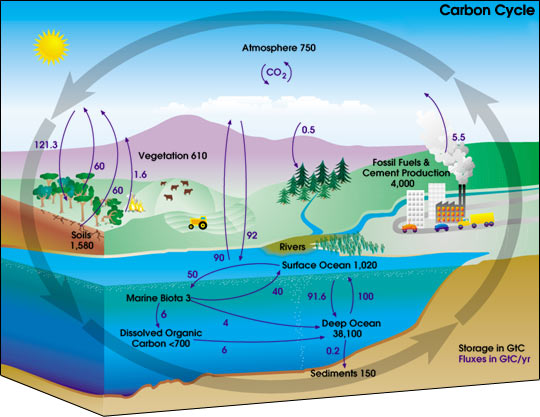
Ocean and land store far more carbon than the atmosphere. They exchange a lot of carbon dioxide with the atmosphere and also take up a major fraction of the additional carbon dioxide which is released by humans.
|
The annual net exchange of CO2 between land and atmosphere is about eight times as high as the annual emissions from human activity. But this also means: If there is a slight shift in the "in" and "out" between land and atmosphere and ocean and atmosphere, the CO2 concentration in the atmosphere can change significantly and consequently it will have an impact on global warming.
Climate models are being continuously improved and are becoming more advanced with increasing computer capacity. Until a few years ago, the models did not yet include this feedback of the climate system with the carbon cycle.
|
|
 |
|
|
1. The carbon cycle. There is an intensive exchange between land, atmosphere and oceans, which is by far larger than the human emissions of CO2. The exact numbers (here in Gigatons of carbon GtC) vary from one year to the next. © NASA Earth Observatory -> Carbon cycle
|
|
|
|
|
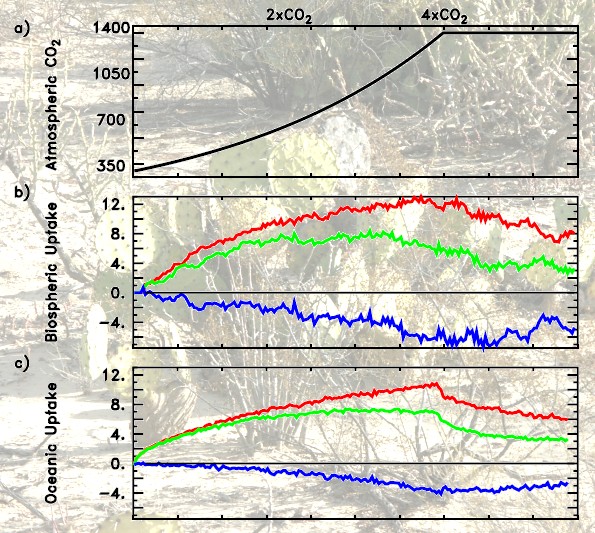
All studies which have been carried out in recent years have come to the conclusion that in a warmer world the capability of land and ocean to take up further CO2 is reduced compared to now. The land is at present a weak sink for CO2. But due to increasing drought and reduced vegetation it could turn into a source. These possible feedbacks have been included for the first time in the fourth IPCC report. It leads to a slight increase in the uncertainty range of the estimated warming until 2100 and in particular to a stronger warming for high emission scenarios.
|
2. The graph shows in part b) and c) in red the uptake of carbon dioxide by land and ocean for a simulated exponential increase in CO2 concentrations (a) and for a constant climate. The green curve shows the smaller uptake considering climate change. The difference is shown in blue. This additional amount would remain in the atmosphere and cause further warming.
Model results, Source: Friedlingstein et al., Geophys. Res. Letters, 2001. |
The retreat of the ice
The observed reality in the arctic regions gives the clearest hints that climate change is taking place. Also climate models suggest the strongest warming in the arctic. The ice on the ocean (sea ice) is melting (about 2.7% loss per decade) thus destroying the environment of some animal species (e.g. of the polar bear). Strong oscillations have been observed in the sea ice extent of Antarctica, but so far there is no clear trend.
A complete melting of the Greenland ice sheet is not impossible. It would cause a sea level rise of about 7 m. But this process would most likely take several centuries.
|
|
 |
|
|
3. The area in red marks the places where melting is taking place on the Greenland ice sheet. Data come from satellite based microwave measurements. Please click for a full view. (75 K)
Source: Group of Konrad Steffen, University of Colorado, Boulder
|
|
 |
|
|
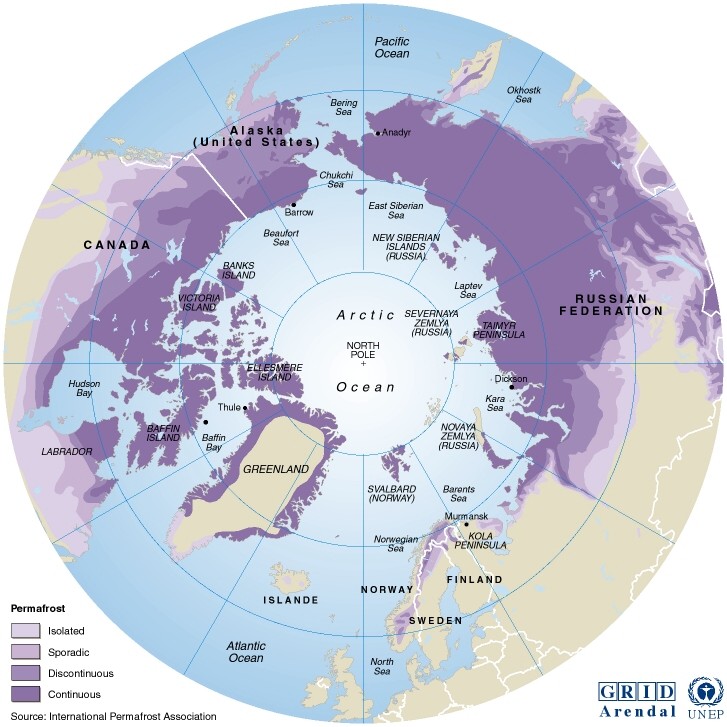
4. The permafrost areas of the northern hemisphere. Map © UNEP
Please click to enlarge.
|
|
|
In parallel, a worldwide retreat of the mountain glaciers is observed. The average snow cover is shrinking. Besides this, the ice is meltingi n permafrost areas, where up to now the ground has been continuously frozen. Since 1900 the northern hemisphere has lost about 7% of frozen ground. This does not only cause problems for the local infrastructure (buildings and vehicles sink into the mud), but also for the vegetation. At the same time the risk increases that a release of until now frozen methane in the ground is accelerating. Methane is a very strong greenhouse gas.
|
Warming of the ocean and consequences
About 80% of the heat which has been added to our climate since 1961 has been taken up by the oceans. They have warmed down to 3000 m depth. This causes two problems: 1. Warm water has a lower density than cold water and takes a larger volume. The oceans expand and the sea level rises. 2. Tropical cyclones (hurricanes, typhoons, ...) require a certain ocean surface temperature for their formation and gain more energy the warmer the water is. The risk zones for such storms slowly extend and the storms tend to become stronger.
|
|
 |
|
|
5. The graph shows the temperature increase in the Northern Atlantic during the last fourty years. The Atlantic contributes more to the warming in the oceans than the Pacific and Indian Oceans together. Please click the graph for a larger view.
|
|
 |
|
|
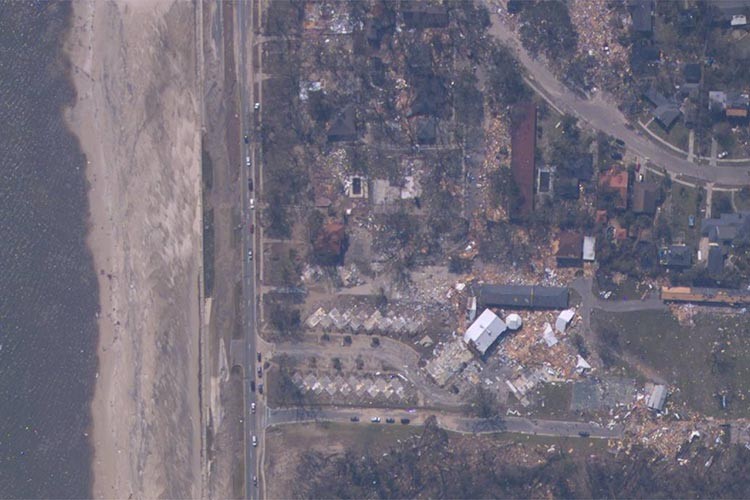
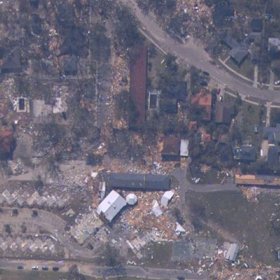
6. The coastal town of Biloxi was destroyed by hurricane Katrina in summer 2005. Source: Satellite documentation of the US National Weather Service, NOAA
|
|
|
Trends in storm activity
Since about 1970 we have observed an increase in the activity of cyclones in the North Atlantic. This comes along with higher sea surface temperatures, but the trend is stronger than climate models predict. There are no indications so far that the number of storms is increasing. In the future they will become stronger, the wind peaks will become more intense and the related precipitation is going to increase.
You will find more about tropical cyclones in an edition ACCENT special "cyclones".
|
|
Sea level rise
From 1961 to 2003 sea level has been rising at a rate of about 1.8 mm per year. This rate has increased in the last ten years to 3.1 mm per year. However, we cannot say yet if this trend is stable or a temporary oscillation.
|
At the moment we expect the sea level to be 18 to 59 cm higher in the last decade of this century (2090-2099) than in the time 1980-1999. However, the shifts in glaciers have not yet been sufficiently investigated in order to include their contribution. 125,000 years ago, when the polar regions were much warmer than today, the melting of polar ice lead to a sea level rise of 4-6 m.
|
|
 |
|
|
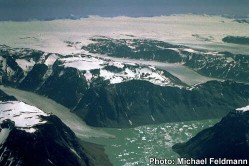
7. The glaciers of Greenland melt faster than they can gain new mass from snowfall. Photo: Michael Feldmann (www.eldey.de)
|
|
|
The sea will expand very slowly, but over centuries without any chance to stop it if the warming has once taken place. Therefore, we have to be aware that we initiate at the moment a stepwise and irreversible flooding of the coasts for a long future.
|
The acidification of the oceans
The increasing carbon dioxide content in the air and the uptake of the gas by the ocean lead to the formation of carbonic acid. Consequently the sea water becomes more acidic. The pH value in the surface water has been falling about 0.1 units since preindustrial times and could decrease by a further 0.14 to 0.35 units in the 21st century.
|
|
 |
|
|
9. Change of the pH near to the sea surface owing to human induced uptake of carbon dioxide from 1700 to the 1990s.
Data: Global Ocean Data Analysis Project; Graph: Richard Zeebe (GNU licence)
|
|
 |
|
|
10. Korallenriff © 2004 Richard Ling (GNU licence)
|
|
|
The consequences cannot yet be foreseen. Metabolism and dispersion of algae are going to change (many of them form sensitive carbonate shells). Algae (phytoplankton) are the first link in the marine food web and a change in the population of algae can change this food web significantly.
Coral reefs, which are called the rainforest of the oceans due to their biodiversity, will certainly be affected. Their stock of calcium carbonate reacts very sensitively to acidic water.
|
|
Precipitation and droughts
Warm air can hold more water than cold air. And indeed the water content of the air has been rising in recent years, over land as well as over the oceans and also in the upper troposphere. This higher water content increases the risk of heavy rainfall and related floodings.
|
 |
|
|
Relative changes in precipitation (in percent) for the period 2090–2099, relative to 1980–1999. Values are multi-model averages based on the SRES A1B scenario for December to February (left) and June to August (right).
White areas are where less than 66% of the models agree in the sign of the change and stippled areas are where more than 90% of the models agree in the sign of the change. Source: IPCC AR4 - SPM
|
|
It is expected that events of very strong rainfall will increase. But the distribution of rainfall is not homogeneous. In the Sahel, the Mediterranean and Southern Asia there have been more droughts in recent decades. The risk of droughts rises due to increasing evaporation. More rainfall has been observed in the eastern parts of the Americas, in Northern Europe and in North and Central Asia. It is not certain if these phenomena are going to intensify precisely in these regions. But in any case the intensification of the water cycle is not advantageous for mankind. Climate models predict that the areas affected by droughts are going to increase and extreme weather events (including strong rain and floods) will become more common.
|
Seven statements for the future
|
|
|
|
 | |
We will observe more warmer and fewer cold days and nights over most land areas.
Image: longer growing periods |  | |
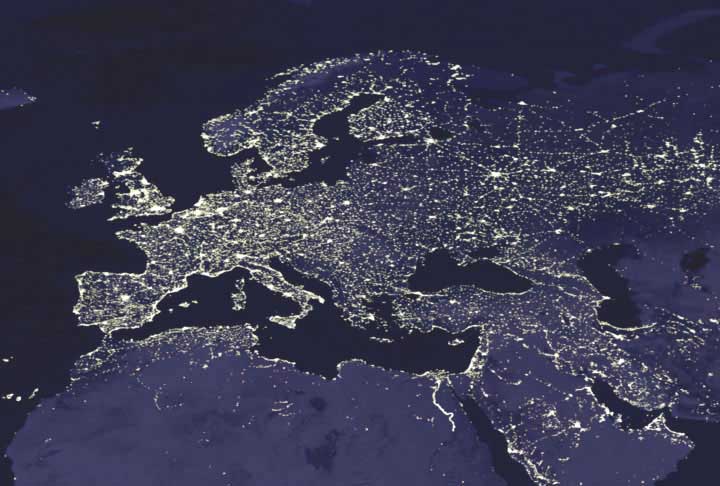
We will experience warmer and more frequent hot days and nights over most land areas.
Image: Night-time activities on the streets in Brazil |  | |
Warm spells and heat wave frequency will increase over most land areas.
Image: "Heat wave" by Andre Laakmann & Lars Nellesen |  | |
The frequency (or proportion of total rainfall from heavy falls) increases over most areas.
Image: Floods in Alicante, Spain (GNU licence) | 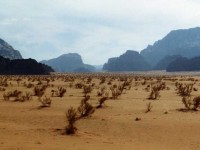 | |
The area affected by droughts increases.
Image: Jordan Wadi Rum (GNU), Photo: Stefan Volk | 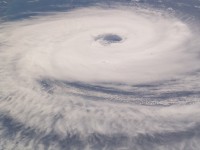 | |
The intense tropical cyclone activity increases.
| 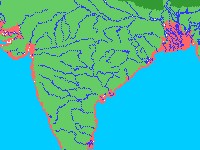 | |
We will experience an increased incidence of extreme high sea level*.
Image: endangered low coastal zones in India and Banglasdesh © FAO |
*Extreme high sea level is defined as the highest percent of hourly tide values for a certain time range.
|
|
|
|