|
|
 |
|
|
|
|
|
|
|
|
The warming of the Earth
A summary based on the results published in the fourth IPCC report (AR4) on the state of our climate system.
|
|
 The world climate report 2007 The world climate report 2007
By coincidence, the climate experts of the world presented the fourth assessment report on our climate system just after a very warm European winter. It seemed the weather would like to give us an idea of how the future climate might be. Since then the topic has been dominating the headlines more than ever because it becomes very clear from the report: There is no time left to put off taking radical measures.
|
 |
|
|
"Man and nature" by: Vugar Agaev, 15 years, Azerbaijan
Internet gallery of the WMO
|
|
|
Most of us, whether children, teenagers or adults, are nowadays aware that the relation of nature and human culture is double edged. In this it is not only nature threatening the human life conditions, but the human way of life is more and more influencing our environment on a global scale. The fourth world climate report summarises what scientists observe and which projections they make. We illustrate in three texts the most important facts and look also at the present human influenced climate change against the background of Earth's history.
|
|
What do we measure and what do we feel?
We cannot easily conclude from the daily change of the weather if the situation in the atmosphere around us is normal or not normal.
|
We may consider as normal when the sequence of weather events over the years is rather similar to the one mankind experienced during the last few centuries on this planet, all the extreme weather events included. But what is not normal? When does only the weather change, and when does climate - i.e. the entirety of the weather observed over at least 30 years - change?
|
|
 |
|
|
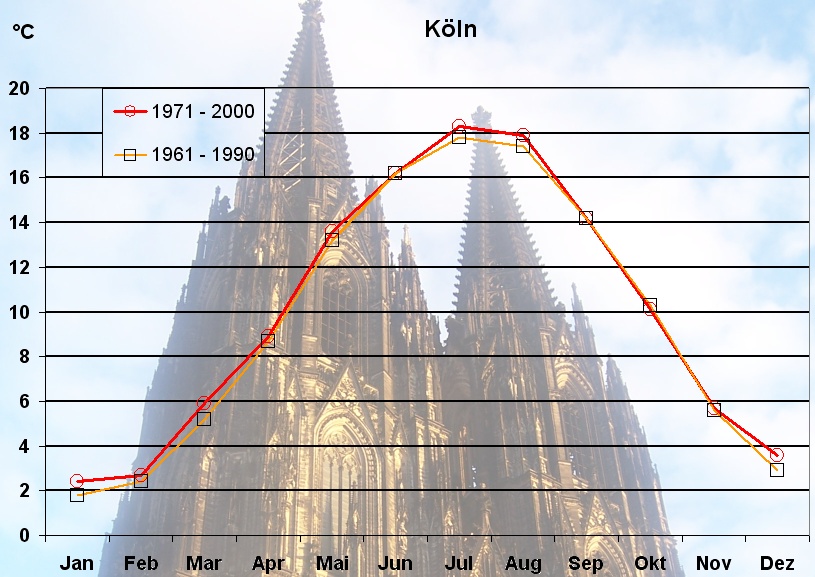
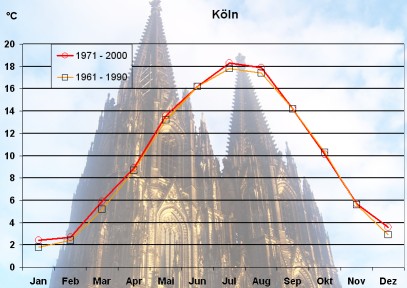
1. We compare the climate chart of the city of Cologne, averaged from daily values of the 30 years 1961 1990 with the one averaged from the equally long period 1971 - 2000. We see that temperature slightly increased (in the annual average from 9.8 to 10.0°C). Data: klimadiagramme.de, graph and photo: Elmar Uherek
Please click the chart in order to enlarge. (150 KB)
|
|
|
|
|
2. If we include in this diagram the daily maximum values (red) and minimum values (blue) of the year 2006 we see that such a climate change of about 0.2°C per decade can hardly be experienced in the observation of the daily weather.
Data: klimadiagramme.de, Graph and photo: wetteronline.de, Elmar Uherek
Please click to enlarge. (95 KB)
Climate is changing
But: How can we be sure that such changes are really a trend, that climate is changing? Weather observers have access to an extensive global database of weather statistics.
|
|
What is the meaning of statistics?
There are quite a few board games in which dice play a role. On the sides of a dice the numbers from 1 to 6 are spread. In some games it is rather advantageous to throw a 6.
|
When I have a very lucky day, 15 of 60 throws may be a 6. That's certainly more than the 10 times I would have expected on average. But the next day it might be only 8 of 60. And if I do this over years, then lucky and less lucky days will even out. That's what we call a statistical distribution. However, if one of my opponents has a die and rolls a 6 2000 times from 6000 throws, then I should seriously consider whether the die is loaded.
|
|
 |
|
|
3. Dice, photo: Elmar Uherek
|
|
|
This simple consideration is relevant for the key statement of the most important report on the state of our climate, which is published by experts from all over the world: climate is changing. It does not tell a lot about the climate, if there is a warm winter in France this year or a cool spring in Pakistan, or if the temperature in Cologne is 0.6°C above average in October.
|
 |
|
|
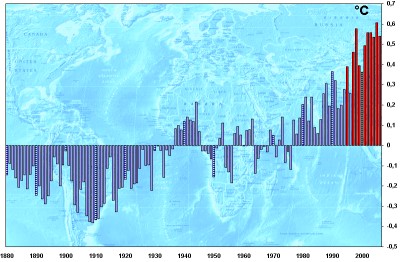
4. The graph shows how many degrees warmer or colder the respective year has been compared to the average of the years 1901 to 2000. The dataset includes land and ocean temperatures. Data source: NOAA, graph: Elmar Uherek
Please click on the illustration in order to enlarge it. (200 KB)
|
|
|
Scientists measure the global average temperature. We have been doing this since about 1850. The result of these measurements is: 11 of the warmest years since 1850 were in the period of the last 12 years, from 1995 to 2006. In the preceding climate report in 2001 we were still unsure if this trend was stable. Today we know: the dice are loaded. Our global climate is clearly leaving the range of statistical oscillations we had so far in this rather stable interglacial period of the last 10,000 years. The climate is changing.
|
|
The temperature trend
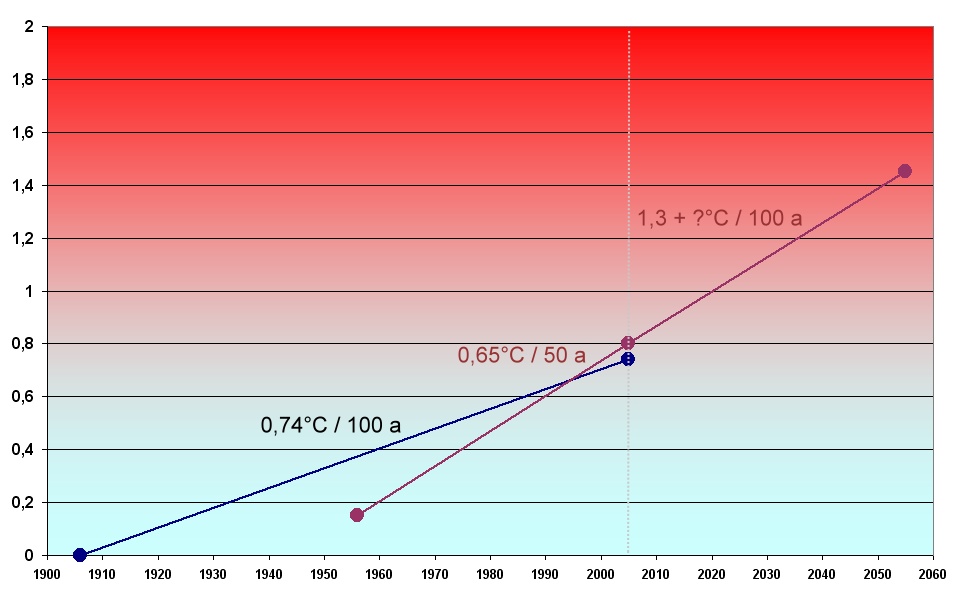
The observed temperature trend can be illustrated with the following graph. The Earth's surface temperature has increased over the last 100 years (1906-2005) by about 0.56 0.92°C (best estimate: 0.74°C).
|
This temperature increase is not steady, it is accelerating. If we take the measured values of the recent 50 years as a base for the increase 1956 to 2055 we would end up with an average increase of 1.3°C per 100 years.
|
|
 |
|
|
5. The trend in world climate: Warming is accelerating.
|
|
|
We already know that global warming will accelerate even more over the next 50 years. This is because the amount of carbon dioxide in the air which contributes significantly to this warming has increased over the last 50 years and continues to increase.
Based on the trend of the last 50 years, we can be rather sure that in 2055 we will look back to a warming of more than 1.3°C over the previous 100 years. At this time, the world will be most likely more than 1.5°C warmer than before industrialisation (1750). The beginning of industrialisation is usually taken as a reference value, since at this time the world climate was widely unaffected by human activity.
|
|
Climate sensitivity
Already from the observed changes we can estimate that our world has become about 0.13°C warmer per decade and that this trend is increasing. For the next two decades climate models expect a warming of about 0.2°C per decade. (We have observed this for example in Cologne.)
|
 |
|
|
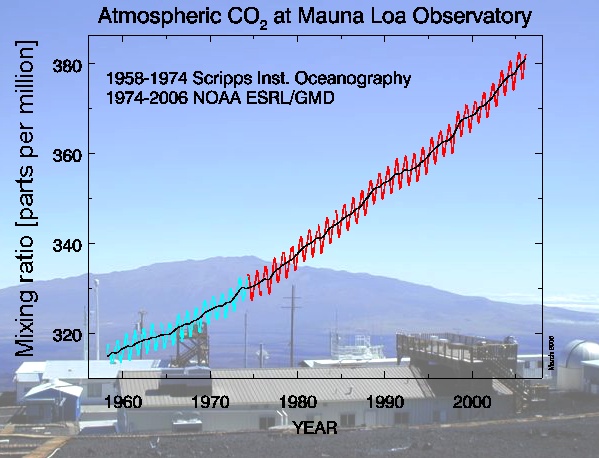
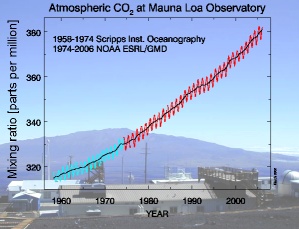
5. At the Mauna Loa Observatory in Hawaii the carbon dioxide content of the air has been measured for many decades. The exact amount oscillates with the seasons (see ACCENT Magazine No1 2005), but the annual average increases continuously.
|
|
|
For long term estimates the so called "climate sensitivity" has been intensively discussed. Climate sensitivity is defined as the warming of the Earth's surface which is expected for a doubling of the carbon dioxide mixing ratio in the atmosphere (from the pre-industrial value of 280 ppm to 560 ppm*). In a previous issue of this magazine we reported that there are larger uncertainties in this (ACCENT special July 2005). The research of the recent years estimates now that planet Earth would warm up in this case by about 2 4.5°C, and at least by 1.5°C. A value of 3°C is said to be the best estimate.
|
|
We have to consider two things: We have already increased the mixing ratio of carbon dioxide in the atmosphere from 280 to 380 ppm, with high speed in particular over the last 50 years and we are continuing to do it unchecked. To reach a value of 560 ppm before the year 2100 is not unlikely.
|
At the same time experts agree that changes in the world climate owing to a temperature increase of 2°C compared to the pre-industrial values (0.8°C are already reality) will have severe consequences but can still be handled.
For more than 2°C, dramatic consequences are expected (flooding of coastal regions, floods due to heavy rain, more droughts, stronger storms, unbearable heat waves, severe political and social consequences due to large migratory movements in the world population caused by escape from uninhabitable regions). The article "research 2" will speak about the consequences of temperature increase.
|
|
 |
|
|
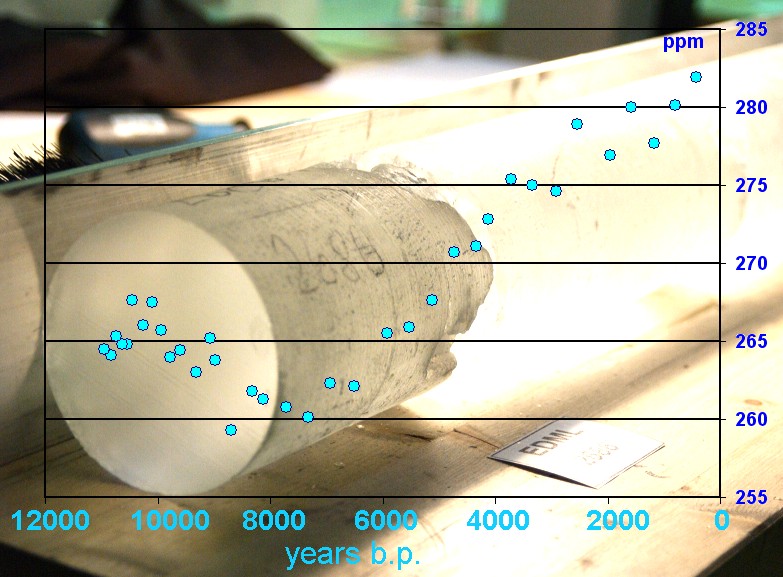
6. We take air bubbles enclosed in ice from ice cores which are drilled in the glaciers of Greenland or Antarctica. They provide information on the climate of the last millennia and hundreds of millennia. They tell us that the CO2 content in the air has never been as high as now during the last 800,000 years. The image shows the values of the recent 10,000 years of our present interglacial.
Image: EPICA ice core; Photo: Sepp Kipfstuhl, © AWI; Data: NOAA, AWI
|
|
|
Cooling by particles and clouds
The greenhouse effect is the most important drive of global warming. However, there are other climate factors working in the opposite direction and causing a cooling. These are mainly effects which are induced by liquid and solid particles in the air (so called aerosols), and indirectly, related to the aerosols, the back-scattering effect of increasing cloudiness.
|
 |
|
|
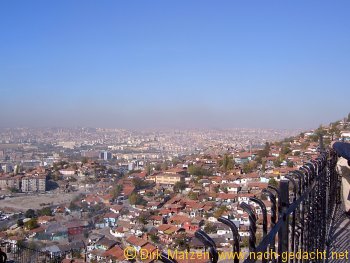
7. Particles in the air like here above Ankara reduce the insolation and provoke a local cooling in the polluted region. Photo: © Dirk Matzen
|
|
|
Thanks to intensive research in the last 6 years we know now more about these effects than at the time of the last IPCC report in 2001. However, uncertainties are still high. In any case we can say that without these cooling effects global warming would be clearly more intensive than we observe now. If particles prevent more solar energy from reaching the ground this is in many cases also an effect caused by humans. In other words: air pollution or smog. Such a supporter against the greenhouse effect is neither intended nor healthy.
|
|
What is radiative forcing?
The disturbances which influence our climate system (e.g. increased concentrations of greenhouse gases or increased cloudiness) have an impact on the radiation budget in the system of Earth's surface and lower atmosphere (troposphere).
|
The energy flow per time measured in the unit Watt (W = J/s) for each square metre of the Earth is called radiative forcing (RF). If this parameter RF (W / m2) is positive, the respective climate factor (for example carbon dioxide and other greenhouse gases) contributes to a warming of our planet. If it is negative, the climate factor (for example aerosols) contributes to a cooling.
In the graph on the right we see two columns with climate factors. The left column shows factors which have a warming impact, the right one factors with a cooling impact. We see the dominant role of the greenhouse gases carbon dioxide, methane (CH4), dinitrogen monoxide (N2O) and organic halogen compounds (in particular CFCs). The greenhouse gas ozone plays a double role, since on the one hand ozone increases next to the ground, on the other hand the stratospheric ozone in the ozone layer is depleted.
|
|
 |
|
|
8. Contributions of different climate factors to a warming or cooling (positive or negative radiative forcing). All greenhouse gases are coloured in green tones. Data: IPCC FAR, Graph: Elmar Uherek
|
|
 |
|
|
9. From our present state in research warming factors dominate, but they have a significant counterbalance. Graph: Elmar Uherek
|
|
|
We see that the cooling effects of particles in the air and additional cloud formation cause a strong cooling. But they do not compensate for the global warming. However, in particular for these cooling factors we are rather insecure about their dimension. Therefore a wide uncertainty range is given. We express this in the graph below. This uncertainty is so large, that in the most extreme case we could assume, that global warming is outweighed by the cooling effects. But this is not in agreement with our observations.
If we see these factors, we need to keep in mind: It is much easier to prevent air pollution, than to remove the carbon dioxide again. This means: the cooling factors are partially short term impacts and mask the warming only temporarily.
|
|
|
 |
|
|
10. The contribution of warming factors is relatively well known. But for the impact of aerosols and clouds there is still a large uncertainty. This graph shows the minimum and maximum of the uncertainty range. Graph: Elmar Uherek
|
|
|
The responsibility of the humans
The present observations cannot be explained from natural processes without human interaction. In a discussion which was still up to date 10 years ago the question was asked: Is mankind responsible for this global warming or is it due to natural oscillations in the world climate or changing solar irradiation?
Experts have been in most cases very careful in answering this question due to limited knowledge. Today, in 2007, the statement is: The understanding of anthropogenic warming and cooling influences on climate has improved since the Third Assessment Report (TAR), leading to very high confidence that the globally averaged net effect of human activities since 1750 has been one of warming.
|
 |
|
|
11. A map of the World Resources Institute (WRI) shows the size of the countries and continents proportional to their contribution to global warming in 2002. © WRI
Please click the map for a full size view.
|
|
Estimations for the future
We expect from the "world climate report" not only a statement about the status quo but also an outlook to the future. Based on many different climate models the experts estimate that in the decade 2090 2099 it will be 1.1 6.4°C warmer on the Earth's surface on average globally than in the reference time 1980 1999. (Please consider, that between 1900 and the reference time 1980 - 1999 a warming of 0.5°C already took place.)
|
 |
|
|
12. The IPCC climate scenarios. The graphs show the warming for different assumptions. The uncertainty is indicated by the grey bars together with the best estimates (coloured marks). The orange line shows the further warming assuming that the concentrations from 2000 would have remained constant. © IPCC, AR4 2007
Please click to enlarge.
|
|
|
This estimation for the future covers a very wide range of temperatures. This is for two reasons. First, not all climate models work in the same way. They are based on different assumptions, mathematical processes and included feedbacks. None of the models can simulate the climate system in its full complexity. Therefore, simplifications are necessary, which lead to uncertainties.
The other reason is that the technical, political, demographic and cultural development in our world by the year 2100 cannot be foreseen.
(See also the ACCENT edition on climate modelling.)
|
|
For our future climate there is a big difference if we change to renewable energies quickly or slowly, or if the world's population peaks in 2050 or continues to grow, if the developing countries progress slowly or quickly in their technological level and if the nations aim primarily at local solutions or converge in a world with fast interaction.
The following table gives an overview of the factors on which the scenarios are based:
|
|
|
B1 |
A1T |
B2 |
A1B |
A2 |
A1FI |
|
Population peaks 2050 |
x |
x |
|
x |
|
x |
|
Population growth continuously |
|
|
x |
|
x |
|
|
Economy regionally orientated |
|
|
x |
|
x |
|
|
Global service and information economy |
|
x |
|
x |
|
x |
|
Development fast and converging |
x |
x |
|
x |
|
x |
|
Development slow, regionally fragmented |
|
|
x |
|
x |
|
|
Emphasis on sustainability |
x |
|
x |
|
|
|
|
Energy fossil fuel based |
|
|
|
|
|
x |
|
Energy mixed |
|
|
x |
x |
x |
|
|
Energy based on renewables |
x |
x |
|
|
|
|
|
|
The abbreviations can be roughly described as follows:
Family A = economy basically not influenced by sustainability
Family B = economy aiming at sustainability
Family 1 = The world population decreases after a maximum in 2050
Family 2 = The world population continues to grow (in A2 faster than in B2)
Variations T, B, FI = energy orientation T = renewables, B = mixed, FI = fossil
|
In none of the scenarios restrictions based on global environmental agreements are counted in, such as foreseen by the Kyoto protocol or the climate convention of the United Nations UNFCCC.
We see that the limitation of global warming to a bearable level ( below 2°C ) is only possible in a converging world with fast technological progress, decreasing birth rates in developing countries and a change to renewable energies. In this it is beneficial if the economy aims at sustainable development.
|
|
 |
|
|
13. The merged temperature charts of Cologne (mid-west Germany) and Milan (Northern Italy) give an idea what a difference of 1.6°C in the annual average temperature means. It is not unlikely that Cologne in 2050 will have the same annual average temperature as Milan had in 1970.
|
|
* ppm (parts per million) or ppb (parts per billion, 1 billion = 1000 million) is the ratio of the number of gas molecules of a certain gas (e.g. the greenhouse gas CO2) to the total number of molecules of dry air. For example: 300 ppm CO2 means 300 molecules of carbon dioxide per million molecules of dry air.
|
|
|
|