espere ACCENT online magazine
Printer friendly version of this page
Home    ACCENT Educ.    Science    Encyclopaedia    es    ru    fr    de    it    cn   
Climate Change classes 1
UQ 3 May 07 Cars and ozone
UQ 2 Mar 07 Urban air
Climate change 2007 IPCC special
UQ 1 Nov Dec 06 Particles in air
Special: Oct. 2006 Communication
Nr 10 Sept. 2006 Africa's emissions
Nr 9 July 06 Air traffic
Special: June 06 Climate summit
Nr 8 April 2006 Ozone & N2 cycle
Nr 7 March 2006 Climate modeling
Nr 6 Feb. 2006 acid rain
Nr 5 Jan. 2006 oceanic sulfur
Special: Nov 05 Ozzy Ozone
Nr 4 Oct. 2005 light/satellites
Special: Sept 05 Cyclones
Nr 3 Sept. 2005 methane/energy
Special: July 05 Greenhouse Earth
Nr 2 June 2005 forest/aerosols
No 1 May 2005 vegetation/CO2
R: Monitoring carbon dioxide
C: photosynthesis and plant emission
A: Activities
L: Links
I: Information for Teachers
     

Download the Worksheet: PDF or Word document

activities

Activities

CO2 uptake and release in nature


 T1

Which major processes release CO2 to the atmosphere? Which take up CO2? Describe in three sentences and include the words:
assimilation - human - vegetation - combustion - animals and bacteria - dissimilation .


_______________________________________________________________


_______________________________________________________________


_______________________________________________________________


_______________________________________________________________


_______________________________________________________________


_______________________________________________________________


world map vegetation

The world map of marine ecosystems and land vegetation (from NOAA).Click on the map for a larger view! (129 KB) Click here for a SUPERSIZE VIEW (1.2 MB)!


 T2

Above you see a world map. Compare the vegetation north of the equator (red line) and south of the equator. Where do you find more forest?
In which of the hemispheres do more people live and where is energy usage highest? Write a short answer.


_______________________________________________________________


_______________________________________________________________


_______________________________________________________________


_______________________________________________________________


_______________________________________________________________

CO2 Mauna Loa


CO2 variation

On the left you see a curve of CO2 variation measured in the Mauna Loa observatory in Hawaii in the Pacific Ocean. The location is marked with a red dot on the map above.

 T3

During which months of the year does the CO2 load of the atmosphere increase? During which months does it decrease? Why? Have a look on the parts of the curve marked in brown (A) and green (B) and give a short answer.


_______________________________________________________________


_______________________________________________________________


_______________________________________________________________


_______________________________________________________________


 T4

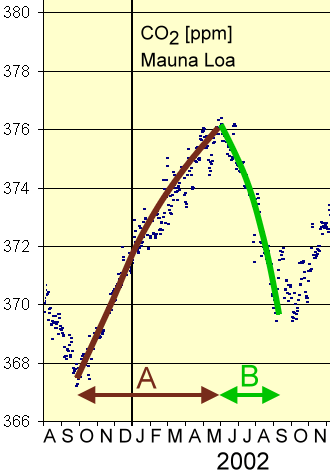
Estimate from the graph above the annual variation of CO2 in Hawaii. Give a number in ppm!

increase:                ppm    -    decrease:                  ppm


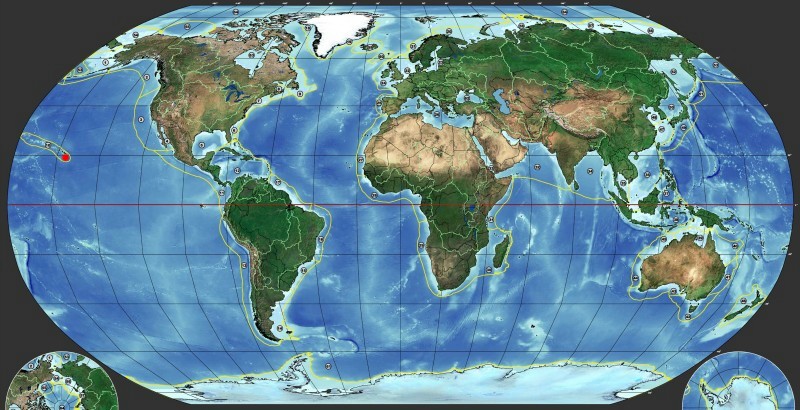
Hawaii is located on the northern hemisphere. CO2 spreads over the whole globe, but exchange across the equator is (as for all gases) relatively slow. So the annual variation of CO2 in the southern hemisphere is different.

Question 1:
In which months of the year do you expect CO2 to increase in the southern hemisphere? Why? Question 2:
Do you think the annual variation of CO2 on the southern hemisphere is stronger or weaker than on the northern hemisphere? Why do you think so?

If you have problems to find an answer, please read also the ESPERE text on "distribution & concentration" of gases in the atmosphere (two paragraphs at the end): http://www.atmosphere.mpg.de/enid/3tf.html


_______________________________________________________________


_______________________________________________________________


_______________________________________________________________


_______________________________________________________________


_______________________________________________________________


_______________________________________________________________

 top

ACCENT / ESPERE

last updated 04.04.2008 | © ACCENT - Atmospheric Composition Change 2013