|
|
 |
|
|
|
|
|
|
|
|
Air traffic and climate
July is holiday time. In the Northern hemisphere, where there is high population density, summer holidays begin and many people leave their homes in order to go on holiday, often travelling long distances, frequently by air. This increase in demand for holiday travel, coupled with business travel and the movement of goods within the global market place means that overall air traffic is continually increasing.
|
 |
|
|
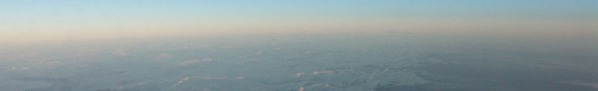
1. Traveling between Europe and North America you have an amazing view on the horizon and the icy world of the mountains in Northern Canada. But how much does our view from a plane contribute to the future melting of this ice? Photo: Elmar Uherek
|
 Low cost airlines and small planes Low cost airlines and small planes
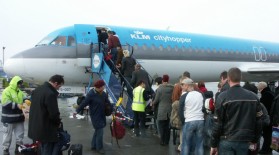
Although the construction of large new airplanes like the Airbus 380 is very popular with the media it will be the smaller airplanes driven by low-cost airlines which dominate the market until 2025. About 60% of the global fleet may be single-aisle airplanes while only 4% will be 747-size or larger.
|
|
 |
|
|
2. Cityhopper - Small planes will dominate the air traffic also in the next two decades. Photo: Elmar Uherek
Please click to enlarge (85 K)
|
|
 |
|
|
3. Development in low fare passengers per year in Europe. Source: Die ZEIT
Please click to enlarge!
|
|
|
The offers of low cost-airlines are a very recent trend which has led to a small revolution in the air transport market. Where flying was previously unaffordable for some, special offers in the range of 20 50 EUR / USD for a flight of 1500 2500 km have given many people the feeling that they could now fulfil their dreams and see the places they were never able to before. Respectively, the number of low-cost flight passengers has grown and the airlines expanded their fleets rapidly.
|
|
Developments
In all mobility sectors the sector of air transport is the one with the highest growth rates. Experts expect an annual growth rate of about 5% for passenger transport and 6% for freight. This means that the amount of passenger kilometres flown could double within the next 15 years.
Comparable estimations were already given in 1999. After the attack on the World Trade Center and during the Iraq war it was not clear whether this forecast would become true. More recently it appears that the long term trend was only interrupted for a short time but not changed.
|
Boeing estimates that about 26000 passenger and cargo airplanes will be delivered in the next 20 years, and only 25% will replace retiring airplanes, while 75% will add to the extension of the aircraft fleet. The annual growth depends strongly on the economical growth rate of a region.
It is difficult to estimate which impact the increasing oil price or political measures like a kerosene tax may have on the expected growth. But we have to be aware that the fuel needs of an expected number of about 38500 airplanes world-wide in 2024 (Boeing) is still small compared to the needs of the global car fleet.
|
|
 |
|
|
4. Revenue passenger kilometres are the product of the number of passengers and the kilometers flown by each passenger. They show a strongly increasing trend. Data source: Boeing
Please click to enlarge!
|
|
|
Climate impacts from aviation
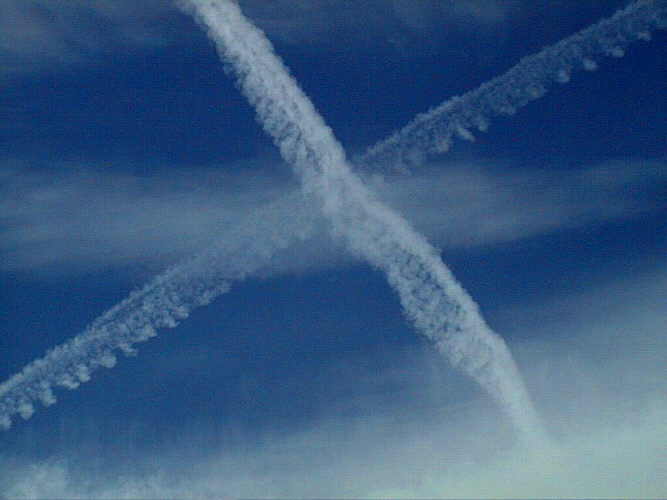
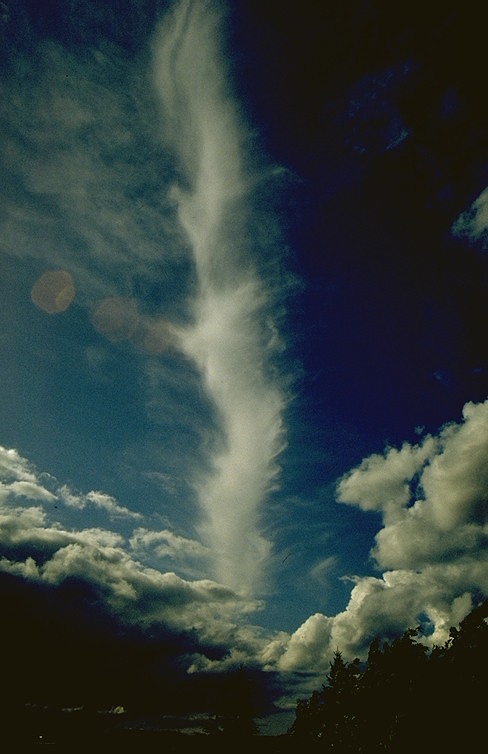
With the increase in kilometres flown by planes for passenger and freight travel, emissions of various pollutants have also increased. These include, in particular, carbon dioxide, nitrogen oxides and others which change the chemical composition of the atmosphere, and water vapour, heat and aerosols, which affect cloud coverage. The emission of nitrogen oxides in the upper troposphere und lower stratosphere (i.e. in the region between 9 and 12 km altitude) leads to further chemical reactions. This has two consequences: the greenhouse gas ozone increases and the greenhouse gas methane decreases. The emissions of water vapour and the released heat triggers condensation trails (so called contrails, fig. 5), which first appear line-shaped and are frequently observed. Winds distort these contrails and form cirrus clouds, which from shape and appearance are not anymore distinguishable from natural cirrus (fig 6), though they are man-made.
|
 |
|
|
7. Increase in carbon dioxide from aviation
Source fig. 7-9: Sausen et al., 2005* - Please click to enlarge!
|
|
|
At the moment construction of planes which could run on alternative fuels does not yet take place for the normal day-to-day market. Consequently, it is foreseeable that these emissions (carbon dioxide, ... ) will increase further and the relative contribution of emissions from air traffic to the greenhouse effect will grow.
But what do climate scientists know about the climate impact from air traffic? And indeed what do they mean by climate impact? Changes in the atmospheric composition and in clouds changes the pathway through which radiation travels through the atmosphere. This change is taken as an indicator and metric (measure) for climate change and is called radiative forcing (RF).
|
Using this metric climate scientists have grouped the climate impact from air traffic into 3 different levels of understanding. First, the effect of carbon dioxide (CO2) is very well understood, since the fuel usage and therefore the CO2 emissions are well documented. A fair understanding of the processes is at the moment assigned to the impact on ozone, methane, and line-shaped contrails. These processes are much more complex than the CO2 cycle, since atmospheric chemistry and cloud physics are involved. However, a large range of observational data and model simulation lead to comparable results and give confidence that the processes are fairly well understood. The most uncertain part is the importance of changes in cirrus clouds by distorting one-shaped contrails or aerosol emissions. There are some hints from long-term measurements that these effects can be the dominant. However, since they are not yet reliable they were excluded from an overall estimate (fig. 11).
|
Fig. 7 - 9: The graphs show how the contribution of aviation to the greenhouse effect grew from 1992 to the year 2000 a) according to the knowledge of the year 1999 (blue, IPCC) and b) according to the knowledge of the year 2004 (red, study 2000). What we see is that both studies make nearly the same predictions for the influences of CO2 and the sum of other factors (methane, ozone, sulphate, soot). But they dramatically differ in the assumptions about contrails.
Contrails and cirrus clouds are thin high clouds and they increase the greenhouse effect. Seven years ago, the Intergovernmental Panel on Climate Change IPCC summarised the available knowledge on the climate impact from air traffic. Although they estimated the knowledge on the contrail related processes as fair, they were not able to reliably quantify its impact; the range of uncertainty was larger than for other impacts (fig 12). More research was needed. The European research project TRADEOFF was able to more reliably estimate the impact of the line shaped contrails. And it turned out that it is more at the lower end of the range given by the IPCC report. This leads to the consequence that, although the emissions from planes are much higher in 2000, the estimated greenhouse effect contribution (the radiative forcing) is 48 mW/m2, not higher than the assumed value from 1992 of 48.5 mW/m2 (fig. 7-10).
|
|
Is the increase in global air transport not relevant for our climate?
If the estimated greenhouse effect from air traffic is the same for 1992 and 2000, but the amount of air traffic has increased, we could say: more air traffic does not have any influence, however this conclusion would be incorrect.
|
 |
|
|
10. In this graph the cumulated effects are shown. With the knowledge of the year 2004 much lower assumptions would have been made for the year 1992 (red, open circle), or: With the knowledge of 1999 we would now make much higher assumptions (blue, open circle). The filled circles show the best knowledge from 1999 (blue) and 2004 (red). Besides from the contribution of contrails they are in rather good agreement. Please click to enlarge!
|
|
|
The greenhouse effect certainly has increased, but scientists do not know the correct absolute values. With the knowledge about contrails from 1999 the effect would have been estimated to be much higher for the year 2000. On the other hand with the knowledge of the year 2004 about contrails we would say that the effect in 1992 was much lower than scientists assumed in 1999.
Is there a way out of this uncertainty?
At the moment not yet. Our understanding of contrails is now better than five years ago but not secure. And we still do not know about the effect of cirrus clouds. We assume that cirrus clouds evoked by airplanes also contribute to the global warming, between zero and an upper limit. But we do not yet know how much. The lack of knowledge in this point causes a comparable potential for corrections of the present values in the future.
|
 |
|
|
11. Aircraft induced radiative forcing: overview of all factors. The values shown in this graph are summarised above in three main categories: CO2, contrails and others. Source: Sausen et al., 2005* Please click to enlarge! (35 K)
|
|
Conclusion
The greenhouse effect caused by airplanes is increasing since the number of passengers times the distance flown (passenger kilometres) is continuously increasing. We can make the most secure forecasts for the greenhouse effect caused by carbon dioxide, which is immediately released from an aircraft. Due to research in this field between 1999 and 2004 we learned more about contrails and think that the effect of line-shaped contrails has been overestimated before. We do not yet know enough about the effect of cirrus clouds which arise from spreading of line-shape contrails or are induced by emitted particles from plane engines, though there are more hints available than in 1999.
|
Author:
Elmar Uherek - Max Planck Institute for Chemistry, Mainz
Co-author and reviewer:
Volker Grewe - German Aerospace Center
This article was developed in cooperation of the European research projects ACCENT and ECATS.
References:
* Sausen et al., Aviation Radiative Forcing in 2000: An Update on IPCC (1999), Meteorologische Zeitschrift 2005
|
|
|
|