|
|
 |
|
|
|
|
|
|
|
|
Context 2: Conditions for the formation of tropical cyclones
|
Key words:
Coriolis force, water temperature, wind shear, climate change, statistical analysis | |
|
How and where do hurricanes form?
We will discuss, in particular, storms in the hurricane region in the Gulf of Mexico. Their roots are in Africa, in the region around the equator. Tropical thunderstorms form in the region where the trade winds from the North and the South come together. They move to the West and appear as small low pressure zones over the ocean.
It cannot be foreseen if and when they will turn into a tropical storm, since the conditions are very complex.
The driving factors are:
a) Rotation of the Earth (Coriolis force)
b) high water temperature
c) absence of wind shear
|
a) Coriolis force
The eddies of a storm are driven by the rotation of the Earth. The Coriolis force does not allow the wind to be directed to the centre of a low pressure zone, but instead the air is swirled around the low. The Coriolis force, however, is low at the equator. Therefore, the regions between 10 - 35° latitude are particularly endangered by storms because here the water temperature as well as the Coriolis force are sufficient.
In the Northern hemisphere the Coriolis force deflects the wind to the right and makes the air move counterclockwise around the centre of the low pressure system. In the Southern hemisphere it is just the opposite.
|
|
 |
|
|
1. The Coriolis force drives the rotation of winds round a low pressure system. Next to the equator this force is weak.
Autor: Anders Persson © gemäß GDFL
|
|
2. The Coriolis force causes a counterclockwise movement of the winds round the centre of a low pressure zone.
|
|
 |
|
|
3. Simulation of the winds in a hurricane on the Northern hemisphere
Source: Homepage Wolfgang Ulrich, Univ. München
Please click the animation in order to enlarge it! (380 KB)
to the original animation (ca. 1.3 MB)
|
|
|
b) High water temperature
Surface water temperature must be at least 27°C and reach a sufficient depth, so that waves and currents do not cool down the surface in the swirl of the storm. A storm above water of 27°C can reach maximum wind speeds of about 280 km/h, while a storm over water of 34°C can get up to 380 km/h. Since water temperature depends on the time of year, tropical cyclones are seasonal phenomena.
|
|
|
|
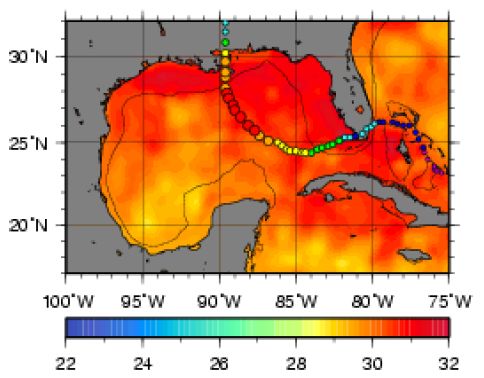
4. Development of the sea surface temperature in the Gulf of Mexico during the passage of hurricane Katrina between August, 26th 2005 (landfall: Aug, 29th) and September, 2nd. It is easily observable that the hurricane stirs the water and the warm upper layers are mixed with cooler water from the lower layers.
Temperature maps: NOAA, Atlantic Oceanographic and Met. Laboratory, animation: Elmar Uherek
Please click the image in order to make it larger. (120 KB) |
|
|
|
Storm track of the centre of Katrina (circles)
The intensity increases from blue to red.
Please click the image in order to enlarge it. (30 KB)
|
|
c) Low wind shear
The surrounding weather conditions must support the low pressure swirl. Opposite wind directions at different altitudes, so-called vertical wind shears, can distract a developing hurricane. Since about 1995, the wind shear in the Gulf of Mexico has, however, been below the long term average and therefore promotes the storm formation.
|
Occurence of hurricanes
As shown above, the occurence of hurricanes strongly depends on the water temperature but also on regions with low wind shear. The sea surface temperature changes seasonally. It exceeds the critical value of 27°C in June in the whole Gulf of Mexico. The conditions for hurricanes are given. The animation shows the temperature in all oceans for the year 2005.
|
|
 |
|
|
7. Development of the sea surface temperature in 2005 until the occurrence of the hurricane Katrina end of August 2005. In the yellow areas hurricanes may develop, the orange-red area is critical.
Temperature maps: NOAA, Atlantic Oceanographic and Met. Laboratory
Animation: Elmar Uherek
|
|
|
The average annual sea surface temperature depends on oscillations in the global weather systems which last over decades. Scientists discovered patterns which show warmer and cooler periods in the Northern Atlantic lasting for about 25 years or longer. Beginning with the regular measurement of wind speeds in storms this pattern was: 1945 - 1970 warmer, 1970 - 1995 cooler, 1995 - most likely 2020 warmer. The hurricane activity is much stronger in the Gulf of Mexico during the warmer periods.
|
 |
|
|
8. Graph from the annual review 2004 of Munich Re geo risk research
|
|
Tropical cyclones and climate change
Many climate scientists worry that stronger hurricanes with higher wind speeds and more rain could devastate endangered coastal regions in the future. The reason for this is the increase in water and air temperatures. Global warming leads to a warming of the air. Warm air can take up more humidity and lead to stronger precipitation. But the warmer air also warms up the water. Storms can gain additional force from this warmer water and reach higher wind speeds. This trend is confirmed in various model calculations. There are however no clear predictions about trends in the frequency of hurricanes.
|
 |
|
|
9. Potential development in the occurence of strong hurricanes in the warmer phases (red background) and the cooler phases (blue background) of the North Atlantic. The warming need not necessarily lead to more hurricanes, i.e. higher values on the Y-axis, but may most likely lead to stronger storms as indicated by the more intensive red colour.
Graph: Elmar Uherek
|
|
Has climate change already an impact?
Hurricanes of different strengths are irregularly appearing events. The statistics with reliable wind speed measurements go back about 60 years. At the moment we are observing an increase in hurricanes in the North Atlantic. However, this can also be attributed to the oscillation between warm and cold phases, according to which more tropical cyclones can be expected for the years 1995 to about 2020. From the few statistics available we cannot make any conclusions about dangerous hurricanes appearing more often as a consequence of global warming. However, hurricanes as Katrina can be seen as a warning signal for warm periods in the second half of this century, when the influence of climate change may be much stronger after the next cool phase.
|
|
|
|