|
|
 |
|
|
|
|
|
|
|
|
Context 1 - from low pressure systems to cyclones
|
Key words:
Low pressure system, cyclone, hurricane, Saffir-Simpson scale, strength / frequency of tropical cyclones | |
From low pressure systems to storms
Regions in which air rises are called lows, low pressure systems, depressions or cyclones. A low pressure system develops when relatively warm and humid air rises from the Earth's surface towards higher atmospheric layers. A system of lines of similar pressure (isobars) encloses a core with relatively low pressure. The rising warm air forms clouds, which often bring rain or snow. In a low pressure system the air coils up towards the core.
If the pressure is very low, the wind can reach the force of a storm and even become a hurricane, typhoon or cyclone. That is the reason why the term "cyclone", which is actually only the meteorological term for a low, is often associated with a storm.
|
|
 |
|
|
1. General scheme of a low pressure system: Air is winding into the low pressure area. Warm and moist air is pumped upwards and spread in higher altitudes. (no copyright)
|
|
 |
|
|
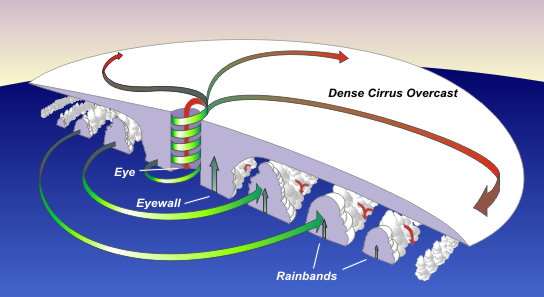
2. Scheme of a tropical cyclone. Under a dense layer of cirrus clouds the rain bands form around the eye of the storm. © NOAA, US National Weather Service
|
|
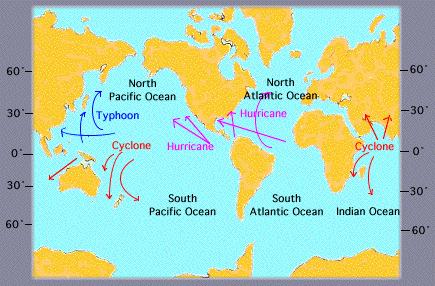
Names and occurence of tropical cyclones (hurricanes, typhoons, cyclones)
Tropical cyclones originate from low pressure systems. This happens in certain regions of the Earth where the water temperature and the evaporation are sufficiently high. They are named hurricane, typhoon or (ambiguously) cyclone, depending on whether they occure in the Atlantic, Pacific or Indian ocean.
|
|
|
|
3. The names of tropical cyclones are different depending on the region they occur.
© Wolfgang Ulrich, Met. Institute, Univ. of Munich
|
|
Regions which are regularly affected by hurricanes are the area round the Gulf of Mexico (Cuba, Haiti, Mexico, Honduras, Southern US). Typhoons threaten the countries of Southeast-Asia: Japan, China and the Philippines. Countries around the Indian Ocean can be affected by cyclones.
|
Properties of cyclones
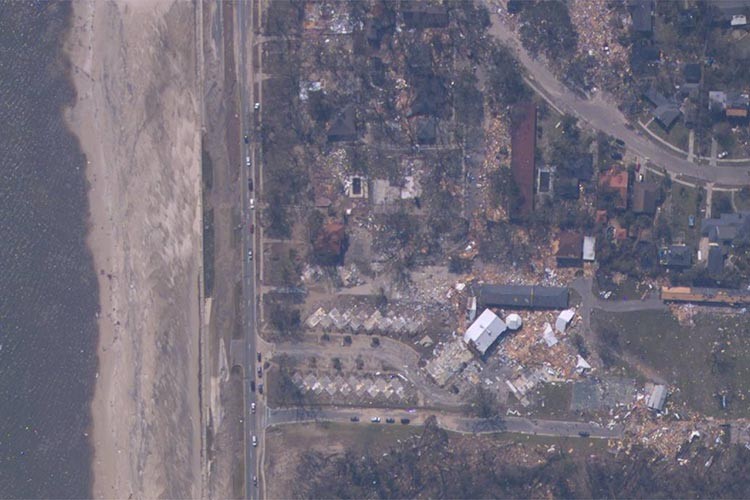
Cyclones have the following properties in common: they soak up enormous quantities of water from the ocean, which then come down in giant cloudbursts. This rain often causes inundations. They can develop high wind speeds in the range of 150 to 300 km/h around the centre (eye) of the storm. In the eye itself, however, it is calm. The wind causes direct destruction by the power of the wind speed itself and indirect destruction by the flood hills which are shifted towards the coastal regions. They can lead to major flooding of the shore line.
|
|
 |
|
|
4. Dynamics of a cyclone around the calm eye. Please click the image in order to enlarge it. (16 KB)
© Wolfgang Ulrich, Met. Institute, University of Munich
|
|
|
Damage and strength / frequency of cyclones
When we try to determine whether cyclones increase in strength and frequency as a consequence of climate change, the damage caused by the storms is not a suitable indicator. The climate changes slowly over decades. In comparable timescales we also have to analyse storm statistics. Relevant indicators are the frequency of storms, the wind speed and rainfall. The damage caused however does not only depend on the weather event itself, but primarily on the behaviour of the people. The economic damage increases if high value goods and property accumulate in storm endangered regions (such as yachts or luxury appartments in Florida). Income from insurance premiums increases if more people insure their goods against storm damage, but also insurers end up paying out more in the case of an increase in storm events. The two graphs below show natural catastrophes and damage for the period 1950 - 2004. They prove that the economic and insured losses grow by far more than the number of extreme events.
|
|
If the inhabitants do not follow the order of the authorities to leave their homes or if such warnings are not sufficient or if people do not have the means to escape (for example people are old or transportation means are not sufficient) or no place where to go due to the infrastructure of the respective country, the number of dead will grow.
|
|
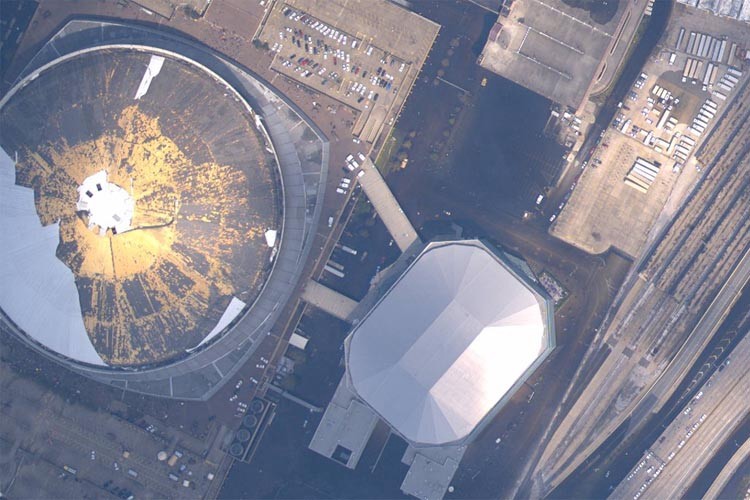
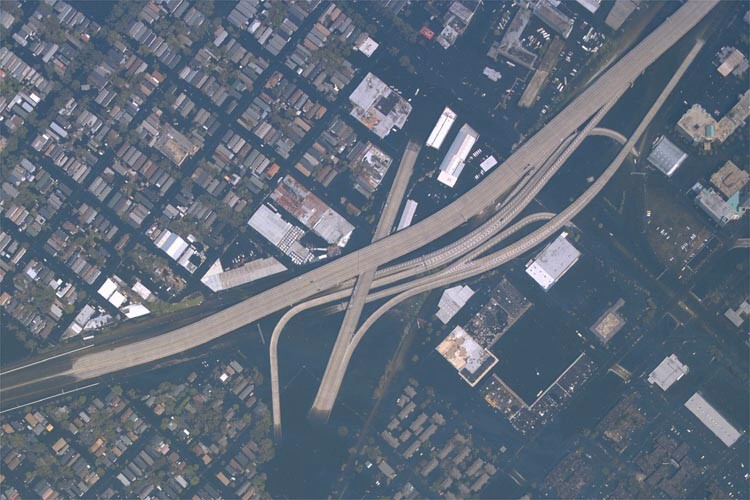
A significant part of the damage assigned to the hurricane Katrina was not only caused by the power of the storm itself but by the fact, that major parts of New Orleans were located below sea level.
The storm caused serious losses for the oil industry. Up to now, the Munich Re reinsurance company had registered the highest damage for the oil industry after hurricane Ivan (mid September 2004):
|
 |
|
|
10. Illustration from the annual review of natural desasters in 2004 - Munich Re
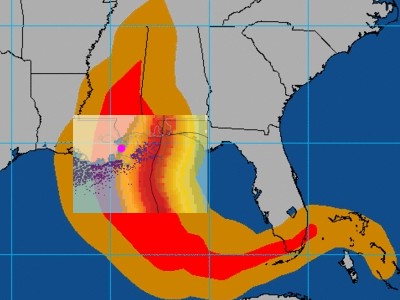
But a comparison of the storm tracks show, that Katrina affected the oil production much more than Ivan. New Orleans is marked as a pink dot on all maps.
|
 |
|
|
11. Superimposition of the storm tracks of Katrina and Ivan.
Original illustrations: US National Weather Service
|
|
Meteorological factors (wind strength, rainfall) and the frequency of storms do not show any clear trend that the occurence of storms has changed due to global warming. (see also the texts 'context 2' and 'research')
|
|
|
|